Tag Archives: Topic Modeling

Part Two, Mapping the Icelandic Outlaw Sagas Narratively

Dear digitalists,

In my last post, I shared a rather lengthy write-up of a geospatial data project I’ve been working on–I hope that some of it is helpful!

Aiming for brevity in this post (and apologies for hogging the blog), I’d like to see if anyone has feedback for part two of the mapping project I’m working on currently. To summarize the project in brief, borrowing directly from my last post: “Driven by my research interests in the spatiality of imaginative reading environments and their potential lived analogues, I set out to create a map of the Icelandic outlaw sagas that could account for their geospatial and narrative dimensions.”

While you can check out those aforementioned geospatial dimensions here, the current visualization I’ve created for those narrative dimensions seems to be lacking. Here it is, and let me describe what I have so far:

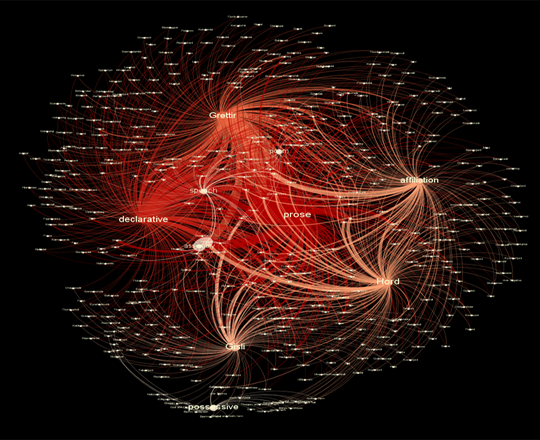
Click through for interactive Sigma map

I used metadata from my original XML document, focusing on categories for types of literary or semantic usage of place name in the sagas. I broadly coded each mention of place name in the three outlaw sagas for what “work” it seemed to be doing in the text, featuring the following categories: declarative (Grettir went to Bjarg), possessive (which included geographic features that were not necessarily a place name, but acting as one through the possessive mode, such as Grettir’s farm), affiliation (Grettir from Bjarg) and whether the place name appeared in prose, poetry, or an embedded speech. Using open-source software Gephi, this metadata was transformed into nodes and edges, then arranged in a force algorithm according to a place name weight that accounted for frequency of mentions across the sagas. I used the JavaScript library Sigma to embed the Gephi map into the browser.

While I feel that this network offers a greater degree of granularity on uses of place name, right now I feel also that it has two major weaknesses: 1) it does not interact with the geographic map, and 2) I am not sure how well it captures place name’s use within the narrative itself.

My question to you, fellow digitalists: what are ways that I could really demonstrate how place names function within a narrative? Should I account for narrative’s temporal aspect–the fact that time passes as the narrative unfolds, giving a particular shape to the experience of reading that place names might inform geographically? How could I get an overlay, of sorts, on the geospatial map itself? Should I consider topic modelling, text mining? Are there potential positive aspects of this Gephi work that might be worth exploring further?

Submitting to you, dear readers, with enormous debts of gratitude in advance for your help! And even if you don’t consider yourself a literary expert–please chime in. We all read, and that experience of how potentially geographic elements affect us as readers and create meaning through storytelling is my most essential question.

Journaling Data, Chapter 2

Statistics and R

I am pursuing two unrelated paths. The first of which is a collaborative path with Joy. She has identified some interesting birth statistics. The file we started with was a PDF downloaded from the CDC (I believe). I used a website called zamzar.com to convert the PDF to a text file. The text file was a pretty big mess, because it included a lot of text in addition to the tabular data that we are interested in.

Following techniques that Micki demonstrated in her Data Visualization Workshop, I used Text Wrangler to cut out a single table and gradually clean it up. I eliminated commas in numeric fields, and extra spaces. I inserted line feeds etc. until I had a pretty good tab-delimited text file, which imported very cleanly into Excel, where I did some additional cleaning and saved the table as a CSV file that would work well in R. The table reads into R very cleanly so that we can perform simple statistics on it such median, min and max.

 Text Analysis

My other data path is working with text, specifically, Dickens’ “Great Expectations”. I have used no fewer than three different tools to open some windows onto the book First a loaded a text file version of the book into Antconc, “…a freeware tool for carrying out corpus linguistics research and data-driven learning.” I was able to generate word counts and examine word clusters by frequency. The tool is very basic so until I had a more specific target to search, I set Antconc aside.

At Chris’s suggestion I turned to a website called Voyant-tools.org, which quickly creates a word cloud of your text/corpus. What it does nicely is provide the ability to apply a list of stop words, which eliminates many common frequently used words, such as ‘the’ and ‘to’. Using Voyant, I was able to very quickly create a word cloud and zero in on some interesting items.

Screenshot 2014-11-09 10.19.59

The most frequently mentioned character is Joe (in fact, Joe is the most frequent word) and not Pip or Miss Havisham. That discovery sent me back to Antconc to understand the contexts in which Joe appears . Other words that loom large in the word cloud and will require further investigation are ‘come’ & ‘went’ as pair, ‘hand’ and ‘hands’, ‘little’ and ‘looked’/looking’.

Lastly, I have run the text through the Mallet topic modeler and while don’t know what to make of it yet, the top ten topics proposed by Mallet make fascinating reading, don’t they?

  1. miss havisham found left day set bed making low love
  2. made wemmick head great night life light part day dark
  3. mr pip jaggers pocket mrs young heard wopsle coming question
  4. boy knew herbert dear moment side air began hair father
  5. time long face home felt give manner half replied person
  6. back thought house make ll pumblechook herbert thing told days
  7. joe don mind place table door returned chair hope black
  8. hand put estella eyes asked stood gentleman sir heart london
  9. good round hands room fire gave times turned money case
  10. man looked biddy sister brought held provis sat aged child

At this point the exploration needs to be fueled by some more pointed questions that need answering. That is what will drive the research. Up until now it has been the tools that have been leading the way as I discover what they can do and what buttons to push to make them do it.


Data Set: Topic Modeling DfR

Hello Praxisers, I’m writing today about a dataset I’ve found. I’ll be really interested to hear any thoughts on how best to proceed, or more general comments.

I queried JSTOR’s dfr.jstor.org Data for Research for citations, keywords, bigrams, trigrams and quadgrams for the full run of PMLA. JSTOR gives this data upon request for all archived content. To do this I had to request an extension of the standard 1000 docs you can request from DfR. I then submitted the query and received an email notification several hours later that the dataset was ready for download at the DfR site. Both the query and the download are managed through the “Dataset Requests” tab at the top right of the website. It was a little over a gig, and I unzipped it and began looking at the files one by one in R.

Here’s where I ran into my first problem. I basically have thousands of small documents, with citation info for one issue per file, or a list of 40 trigrams from a single issue. My next step is to figure out how to prepare these files so that I’m working with a single large dataset instead of thousands of small ones.

I googled “DfR R analysis” and found a scholar, Andrew Goldstone, who has been working on analyzing the history of literary studies with DfR sets. His GitHub  contains a lot of the code and methodology for this analysis, including a description of his use of Mallet topic modeling through an R package. Not only is the methodology available, but so is the resulting artifact, a forthcoming article in New Literary History. My strategy now is simply to try to replicate some of his processes with my own dataset.