Is there an answer to “what to do when everything and everyone are important all the time?” Truth be told, the brain will do what the brain has been designed to– reduce the information into manageable segments. Some stuff will stick. Some won’t.
Laura Klein’s YouTube presentation posted on the CUNY commons for the DH Praxis class offered insight into the use of maps and graphs throughout history. Her demonstrations focused on the powerful influencing capabilities of data visualization.
I simultaneously skipped around watching Lev Manovich present live at MoMA in between pauses to Klein’s video last night. Manovich suggested that digital photography is the new art form now employed by billions of people. He described it as “new, young, and sexy.”
Meanwhile, I spent the past weekend at the 2nd annual conference for the New York Academy of Medicine. The NYAM festival was celebrating the 500th birthday of the anatomist Andreas Vesalius. Early anatomical drawings, it could be argued, were also maps of sorts, charting the human body as early as the 1500s. Dr. Brandy Schillace gave a talk titled “Naissance Macabre: Birth, Death, and Female Anatomy.”
The highlights of Dr. Schillace’s presentation were renderings focused on the pregnant form. The renderings of chaste females were often poised next to potted plants symbolizing the container quality of the pregnant woman. As Laura Klein suggested in her video, the symbolism indicated makes suggestions about how to best view the role of mother in Western culture. She is a vessel.
The afternoon at NYAM concluded with a presentation featuring ProofX 3D anatomical printing, which fashioned a heart valve over the next four hours. The demo-guy gave me his card. Armed with two lectures, several books, and some practical experience I suddenly felt empowered enough to log onto GitHub.
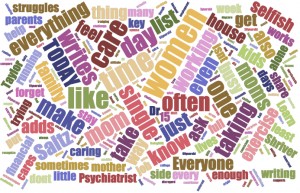
I plugged in a recent article on “Mothers Who Do It All.” Since I haven’t gotten into the programming end yet, I opted for the word cloud. Initially punching in 256 words from the article. I reduced them to 230 (so I could slightly control the visuals) and have uploaded the by-product here.
 The article cited wasn’t brilliant. It’s a rehash of the same old problem and doesn’t get to the point of possibly viewing women as intelligent procreative forces. Instead it’s a familiar subject from my days as an artist 20 years ago. How can women do it all, and make music too? (See MaMaPaLooZa). The word cloud isn’t particularly stunning either, but it represents a leap for in terms of the subject of “motherhood,” DH and how mapping might eventually lead me somewhere? (I couldn’t find anything of major consequence in my Google search).
Let me also conclude this blog by acknowledging that I recognize what a ‘soft’ subject motherhood is. To use Lev Manovich’s words, I’m not even sure it is very “sexy.” Even the word cloud looks “soft” evoking a “Hallmark Cards” visual. I know the subject doesn’t sound scientific or technical, and I’m not even sure what my angle is yet (although I have a few ideas). But as Laura Klein indicated in her presentation, while some cartographers, and data graph makers knew exactly what they were doing, others didn’t always have a clear concept at the onset.
If anyone finds any references to data, the digital humanities, and motherhood please send them my way. I’d be most interested. ~MJR

