Category Archives: Fall 2014

Lab Journal 1

Earlier in class I felt unsure about whether or not to promote my project proposal: The Tokyo Destruction Diary. To recap, my idea was to create an interactive map of Tokyo where certain points of interest were highlighted and when a user clicked on them they gave data and historical context to an actual attack or disaster that happened there (earthquakes, fire-bombings, terrorist attacks, etc). Other points would give information about popular media (comics, movies, games) that have stories tied to the destruction of Tokyo. The two categories of fictional and actual destruction would cross reference each other to give the viewer an encapsulation of Japanese media and history, and how societal fears can be expressed through popular media.


I felt genuine conflict about whether or not my project idea was worth pushing, whether it was a battle worth fighting. The final grade on my proposal for my project made me realize some of my shortcomings. Prof. Gold considered TDD a good general project idea, but found it lacking in a humanities focus and I was at a loss for figuring out the nitty-gritty about how to execute the project beyond just using a map based program like Neatline.


I have the basic idea (explore Japanese art/culture through events in history and vice versa). I have the knowledge and passion for the subject. But ultimately, I lack the technical know-how to fully realize my idea, and I would find myself relying on other people almost completely to realize certain aspects of it. Granted, part of this exercise is learning how to rely on others, but I feel like it would be irresponsible to rally the class to construct a building I didn’t have blueprints for, so to speak. Also, the information about fictional destruction would be tricky to gather in mass quantities or from databases. It would rely more on an individual knowledge of the subject matter (mostly from me). I feel like the project would need a serious re-evaluation before it could be considered good enough to pitch.


#Skillset Renzo

Outreach & Project Management: My current passion project is producing a YouTube series where I interview artists, publishers, and creators working in comics. So I have to stay abreast of what artists are big, who’s up and coming, and what are the new trends. Then I have to find those people that are now or soon will be movers-and-shakers and convince them to sit down and talk to me, then work with my editor to make something watchable. So keeping this going feels a bit like outreach and project management combine.

Developer: I have a modest knowledge of Photoshop from running a little blog about old Japanese magazines. Other than that my technical know-how could be better.

Design: After working in film distribution, art museum management, blogging, and film producing, I’d like to think I have a decent grasp of aesthetics and what looks/feels right on a project.

I make good connections with contacts and get some mileage out of a small amount of information.  I do some freelance journalism so I enjoy writing. My previous work was in museum and PR for a horror movie company, so my knowledge spans from art history to how to make a convincing looking exploding head using common household items. I like connecting the dots between things. Think of it as playing Six Degrees of Kevin Bacon, but with arts, world events, people etc..


Officially a Digital Humanist

I’m excited to say that I’m officially a digital humanist.

I just posted the first of my final papers online, and I’ll be sending a print copy to my professor as well.  Electric Mommyland; Writing a Sociological History Through Auto-Ethnographical Art and Music Performance Towards a Deeper Understanding of Everything Mom for Hester Eisenstein’s Sociology of Gender class at CUNY, The Graduate Center is here. [LINK]

A submission form invites users to post feedback and make suggestions for edits. These will be incorporated in my thesis (2015).

Thank you so much all your collaboration, and for being such a great group this fall.

– Works In Progress –

We are all works in progress, eh?

I know I’ve brainstormed on no less than five projects during the last few weeks. But, each time I say them out loud or bring them to a meeting w/Steve or Matt they just don’t seem “quite right.”

This weekend I wrote a 15 page paper about “Oral Histories,” but it ended up not being to my liking. This class however, I do like.
Perhaps that’s why I’ve spent so much time experimenting.
Here is a project report.

I only have one more day to see what I’m going to pitch — I promise to ONLY pitch one!

But, if anyone has feedback I WOULD BE TOTALLY GRATEFUL.

PROJECTS:

Joy_Baby

PITCH 1.

PROJECT – Mapping Electric Mommyland [Link to project posted on my BLOG]

As part of my thesis I trace the efforts of Mom Rockers across several continents–as they play instruments, write songs, and create community. I argue this community metamorphosed into “everything mom” recognized today in the context of  “mommy bloggers,” “The Housewives of Beverly Hills,” and “Rita Rocks,” among other things. The movement formed organically as a source of empowerment and connection, in the late 1900s. Within four years an assimilation process began. By 2006 motherhood was being used to sell everything from sex, to diapers and dishwashers. The purpose of my thesis, “Electric Mommyland; Writing History Through Ethnographical Art and Music Performance Towards a Deeper Understanding of Everything Mom,” is intended to mark a time in history, when HER-story was on the rise. This project was inspired by RaveArchive and the aim would be to exhibit aspects of MOM music, culture, and history in an interactive digital format.

Article: http://www.bbc.co.uk/news/magazine-15625457

– OR –

CUNY_speaks_logo_web

PITCH 2.

CUNYspeaks!

Communication between students at the Graduate Center can be challenging. Blackboard is not an interactive technology. Students can find access to resources in multiple locations but not have good tools to correspond with each other outside the classroom.  I propose a project that standardizes an Academic Commons web template, and puts it in the hands of even the most technologically challenged group.  These will be called CUNYspeaks! websites and they will allow every student, within every class, to interact with each other. I built a sample experimental website here: [LINK]

– OR –

maxresdefault

PITCH 3

CUNYspeaks!

The Graduate Center currently has no repository for oral history. Inspired by the New York Public Library initiatives, and the Columbia University Archives, I argue that the Graduate Center should do more to capture the passionate and authentic voices of the distinguished professors, staff, and students who comprise it. CUNYspeaks! will introduce students to the Graduate Center by way of an oral history project that situates itself within the larger New York community. I built a sample oral history page here: [LINK]

Oral History Research: NYPublic Library http://oralhistory.nypl.org/

– OR –

BTG_1

PITCH 4 

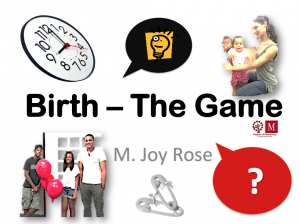
PROJECT – Birth; The Game

Birth; The Game is an online game that engages users in a pre-and post-conception interactive journey. Players are prompted to answer questions and make decisions that lead to unexpected outcomes. Birth the game is meant to educate users about the facts of life while inspiring them to engage in thoughtful responses. Gamers are linked to texts, images, academic interdisciplinary perspectives, and real-life resources. These are designed to enhance intersections between contemporary academic discourse and users within the sciences, arts, and history of birth and caregiving. Designed as an app and as interactive web portal meant to increase digital assets in the area of biology, history, sociology, economics, feminism, and “Mother Studies;” Birth-The Game aims to increase public engagement. The aim is to make this information widely available, accessible and appealing, in a fun, collaborative way as it pertains to human births, animal births, and the Digital Humanities. I built a sample experimental website here, but did not finish it: [LINK]

It is now possible to have a virtual baby online. This weekend I registered for an embryo that is now growing in/on my cell phone, and signed up to play “Virtual Families.

Great example: http://www.ardeaarts.org/birthBeta/

Better Birth through Games Book Sources: http://www.igi-global.com/article/better-birth-through-games/93028, Digital Birth: http://citris-uc.org/health/project/digital-birth, http://www.nucleuscatalog.com/normal-vaginal-birth-childbirth/view-item?ItemID=1614

-OR-

PITCH 5

PROJECT – Conferences in a Box or ConferenceCommons.org

How many times have you gone to an academic conference, met lots of great people and heard amazing presentations? Then—poof; its over, without a trace. Conferences in a Box is envisioned as a complete web-package resource that hosts and posts attendees names, contact information, presentation titles, social media feeds while directing twitter feeds throughout the event. It will also archive power-point presentations, and offer live-feed video through a password-protected portal post-event. Streamlining content, increasing availability, and preserving access to materials and resources, are the goals of this offering. By using new digital modes of publication Conferences in a Box hopes to set a higher bar for the dissemination of humanities scholarship.

Example: ER&L (http://electroniclibrarian.org/conference-info/, http://www.psav.com) not well maintained. Only includes one conference. I would hope to have a site like HASTAC that is ONLY all about conferences.


Final Cuts Part 1: Cellphones and Jesuits

Right now I am working on re-shaping my final project and possibly taking a new approach that takes a more curatorial/archival approach to the preservation of fan publications related to events and conventions.

But for my first attempt I tried writing about more contemporary issues along with dwelling on the morality of DH, but grew frustrated with trying to figure out a direction for the paper to go in. When I showed what I had written to a friend, they said that it felt like two different papers, so that’s how I’m presenting what I’ve done so far to you. I might re-work these segments to be part of the final paper, but I’m still mulling that over. For now though, here’s part one.

Convergence Culture by Henry Jenkins, is a book released in 2006, and it feels very present while also being part of a major pre-Twitter era of social interaction through the lens of communication technology. It covers the convergence of old media, new technology, and social media at its infancy. It was written at a curious point just before the explosion of Twitter, which has gone from that thing old people hated because it limited how many characters are used in a sentence, to a lifesaving tool, PR machine, and government communication tool all in one. It opens with our intrepid author recounting his experience trying to find a mobile phone that was purely a phone. The iPhone would not make its debut until a year after the publication of this book. “[I] wasn’t interested in something that could show me movie previews, would have customizable ring tones, or would allow me to read novels.” He goes on to explain that such Spartan phones have only recently vanished from the marketplace due to lack of demand. During my Thanksgiving break from classes I had a chance to meet up with some old high school friends. One of them is currently an accountant and making a decent living, but rather than using a contemporary smartphone, he uses an old style flip phone, which some of my friends refer to as a “burger-phone.”

“The only people that use burger phones [by choice] are drug dealers, crooked cops, or cheating on their wives!” my other friends chided. This could be seen as a typical anecdote about Christmas season haves-and-have-nots or being a modern day Luddite. But it also frames a very interesting perspective on giving connectivity a moral stance. True, older flip phones did have internet functionality. You could browse some websites, play some games, check your email, and buy some ringtones (a lucrative market according to Jenkins in 2006), but all in all their connectivity was fairly limited. Meanwhile today’s phones use wireless internet, and have a never ending supply of social media apps, programs that make keeping track of tickets more efficient, electronic wallets, camera and more. If the only people that want to be off the grid are crooks or the unfaithful, than that means connectivity, and therefore owning a smart phone to foster that connectivity, is a virtue. 

Since I had gotten a Jesuit education at Fordham University for my undergrad study, I took a small shred of pride in the fact that the father (in more ways than one) of Digital Humanities was Roberto Busa. Though I do not recall many memories of Fordham being particularly technologically advanced while I was there. In fact the internet speed was rather dreadful. But on a recent excursion to my alma mater for a reunion I saw that one of the old dorm buildings had now been converted into a sort of stock exchange and commerce information center. Pristine glass walls (perfect for showing off what’s within) surrounded a room filled with row after row of computers running Windows 8 while a large monitor at the head of the room displayed a map of the world along with various charts and infographics and a stock ticker lined the ceiling like stripe of fluorescent icing on a cake. Thinking back to my mandatory class readings on spirituality, I recalled the story of John the Baptist, he who lost his head to Salome, wandering through the wilds and subsisting on honey straight from the hive. Goodness and piety was seen as something removed from society that we must seek out. But since the 17th century the Jesuits have enjoyed a reputation for their predilections towards scientific discoveries and education (along with colonialism, religious persecution, and the usual gamut of Catholic controversies. I wonder if there’s such a thing as “digital colonialism”), that it adds to Father Busa being the first person to try and take St. Thomas Aquinas’ writing and move from the Illuminated Text to the punch card, and ultimately to the ether of ones and zeroes. Meanwhile social media has led to heightened social awareness and even a lifesaving tool while pundits claim it is only a tool of vanity. New data is being discovered from old artifacts, and hobbies have become gateways to political ideologies instead of being monastic and isolated affairs. Many laud computers because they are neutral. Ones and zeroes with no credo or prejudices. But the question I posit is whether or not the Digital Humanities can be considered a virtuous form of study and is there an inherent virtue in connectivity, the internet, and digital convergence?

Jenkins mention, with not un-due skepticism, how in the 90s it was predicted that convergence media and culture from the newly birthed internet would be the greatest sword ever wielded against media conglomerates, and that entertainment would become a cluster of cottage industries. Jenkins skepticism in 2006 was due in part to the dot-com bust that happened only a scant few years ago. I still have my own memories of the pets.com sock puppet being everywhere on TV in the early oughts, and then his fall from grace as he became a symbol for the over-eager dotcoms collapsing in on themselves (and now he’s just an old relic on YouTube). Now in 2014 we can see some of that come to fruition while in some ways the prediction has been subverted.   Media conglomerates no longer have the same sway they used to, but it is hardly as if they have none. Now everyone wants to be part of their own cottage industry, particularly on YouTube, myself included.

My first attempt at a project was based on the social media platform tumblr. Like Livejournal before it, tumblr has emerged as the platform of choice for teens and twenty-somethings to espouse their day-to-day woes and tribulations. But added to the mix are throngs of artists, some professional, many not that gravitated towards the platform because of its lax content restrictions, as opposed to DeviantArt. My initial idea was based on the large amount of international users across tumblr. Many of them were artists working in some kind of cottage industry, selling prints, commissions, assorted tchokies with their art on them, or otherwise using tumblr as an extension and media presence for whatever industry they’re already in (journalism, comic books, translations). What I set out to do was to see if there is any kind of correlation between where tumblr users are located and where the people they in turn follow are located. I was hoping to find a great web that bound together finds of niche fandoms with content creators, and see how international borders now meant nothing. That is until I sought some input regarding my idea.

The critiques I received made me remember what a valuable currency information is. In Neal Stephenon’s novel Snow Crash (a sort of tongue-in-cheek counterpoint to William Gibson’s grim-n-gritty Neuromancer) the character YT is a fifteen year old courier that also makes her living as an information broker, collecting valuable data on just about anything she can get her hands on to sell to interested parties. The information I was seeking would indeed be an interesting way to connect the lines of fandom that have been used as a web to bring fans together for decades, but now such data would be considered a form of invasion of privacy or just another boon for advertisers.   

NYPL Labs visit

Yesterday’s visit by NYPL Labs was inspiring. What we discussed today was mostly discussed before in the semester, but it was refreshing to hear it from non-academics, DH practitioners who carried a passionate and playful tone (though still obviously knowledgeable) that wasn’t over-analyzing/intellectualizing/rehearsed (that’s not to say that our previous guests were). Josh (?) was almost poetic in describing how they aimed to “breathe life into the collection” and save it from being “frozen in amber.”

As I mentioned in class, I’m proposing a project of digitizing an series of installations curated by the APA Institute at NYU. I’ve been tackling some methodological and theoretical issues that we luckily addressed, mostly on the original consumption of the archive, observer’s experience of serendipity, and how to address what is not represented.

  • What was the original intended consumption of the archived object and how do we translate it something that is native to digital? Johanna Drucker addressed this in her critique of eBooks, which “often mimics the most kitsch elements of book iconography” and in doing so we only stimulate “the way a book looks” (Drucker, 2008, 216-217) and not thinking about how it is used and how we can extend that type of thinking to the digital environment. The NYPL Labs had a creative take to this question with their 3D images site, http://stereo.nypl.org/.
  • How do we recreate the experience of accidental discovery/serendipity in the digital space? During Kathleen Fitzpatrick’s visit, she spoke about the technicality of this, by collecting metadata and tagging. In Planned Obsolescence, she delves a more into looking at the structure of the original material and the digital environment, going beyond the ink to pixel conversion. The NYPL Labs guys echoed the same notion about structure, that a serendipitous discovery is surprising but not random because the data belongs in a structure and it is transparent how you arrived at your discovery. But they also questioned if this recreation of serendipity is in the power of the creator.
  • Stating your limitations of your project. Like scientists, we should the boundaries of our experiments, noting what was specifically included and excluded so it is not assumed that the results reflect all data (whatever that means). In the world of google and wikipedia, we need to be mindful of the constant creation and revision of knowledge. Even with tools for data scraping, we still need to question what is being left out and why.

They shared some great links. Here are some that I noted in case you wanted to revisit:

Drucker, Johanna. 2008. “The Virtual Codex from Page Space to E-space.” In A Companion to Digital Literary Studies, ed. Susan Schreibman and Ray Siemens, 216-32. Oxford: Blackwell.

Part Two, Mapping the Icelandic Outlaw Sagas Narratively

Dear digitalists,

In my last post, I shared a rather lengthy write-up of a geospatial data project I’ve been working on–I hope that some of it is helpful!

Aiming for brevity in this post (and apologies for hogging the blog), I’d like to see if anyone has feedback for part two of the mapping project I’m working on currently. To summarize the project in brief, borrowing directly from my last post: “Driven by my research interests in the spatiality of imaginative reading environments and their potential lived analogues, I set out to create a map of the Icelandic outlaw sagas that could account for their geospatial and narrative dimensions.”

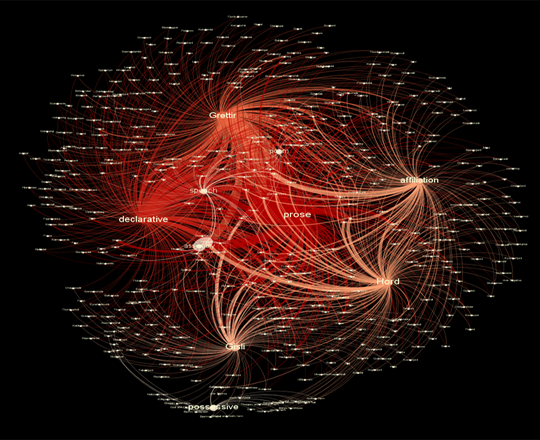
While you can check out those aforementioned geospatial dimensions here, the current visualization I’ve created for those narrative dimensions seems to be lacking. Here it is, and let me describe what I have so far:

Click through for interactive Sigma map

I used metadata from my original XML document, focusing on categories for types of literary or semantic usage of place name in the sagas. I broadly coded each mention of place name in the three outlaw sagas for what “work” it seemed to be doing in the text, featuring the following categories: declarative (Grettir went to Bjarg), possessive (which included geographic features that were not necessarily a place name, but acting as one through the possessive mode, such as Grettir’s farm), affiliation (Grettir from Bjarg) and whether the place name appeared in prose, poetry, or an embedded speech. Using open-source software Gephi, this metadata was transformed into nodes and edges, then arranged in a force algorithm according to a place name weight that accounted for frequency of mentions across the sagas. I used the JavaScript library Sigma to embed the Gephi map into the browser.

While I feel that this network offers a greater degree of granularity on uses of place name, right now I feel also that it has two major weaknesses: 1) it does not interact with the geographic map, and 2) I am not sure how well it captures place name’s use within the narrative itself.

My question to you, fellow digitalists: what are ways that I could really demonstrate how place names function within a narrative? Should I account for narrative’s temporal aspect–the fact that time passes as the narrative unfolds, giving a particular shape to the experience of reading that place names might inform geographically? How could I get an overlay, of sorts, on the geospatial map itself? Should I consider topic modelling, text mining? Are there potential positive aspects of this Gephi work that might be worth exploring further?

Submitting to you, dear readers, with enormous debts of gratitude in advance for your help! And even if you don’t consider yourself a literary expert–please chime in. We all read, and that experience of how potentially geographic elements affect us as readers and create meaning through storytelling is my most essential question.

Mapping the Icelandic Outlaw Sagas

Greetings, fellow digitalists,

*warning: long read*

I am so impressed with everyone’s projects! I feel like I blinked on this blog, and all of a sudden everything started happening! I’ve tried to go back and comment on all your work so far–let me know if I’ve missed anything. Once again, truly grateful for your inspiring work.

Now that it’s my turn: I’d like to share a project that I’ve been working on for the past year or so. I’ll break it down into two blog posts–one where I discuss the first part, and the other that requests your assistance for the part I’m still working on.

A year ago, I received funding from Columbia Libraries Digital Centers Internship Program to work in their Digital Social Sciences Center on a digital project of my own choosing. I’ve always gravitated towards the medieval North Atlantic, particularly with anything dark, brooding, and scattered with thorns and eths (these fabulous letters didn’t make it from Old English and Old Norse into our modern alphabet: Þ, þ are thorn, and Ð, ð are eth). Driven by my research interests in the spatiality of imaginative reading environments and their potential lived analogues, I set out to create a map of the Icelandic outlaw sagas that could account for their geospatial and narrative dimensions.

Since you all have been so wonderfully transparent in your documentation of your process, to do so discursively for a moment: the neat little sentence that ends the above paragraph has been almost a year in the making! The process of creating this digital project was messy, and it was a constant quest to revise, clarify, research, and streamline. You can read more about this process here and here and here, to see the gear shifts, epic flubs, and general messiness this project entails.

But, to keep with this theme of documentation as a means of controlling data’s chaotic properties, I’ve decided to thematically break down this blog post into elements of the project’s documentation. Since we’ve already had some excellent posts on Gephi and data visualization, I’ll only briefly cover that part of my project towards the end–look for more details on that part two in another blog post, like I mention above.

As a final, brief preface: some of these sections have been borrowed from my actual codebook that I submitted in completion of this project this past summer, and some parts are from an article draft I’m writing on this topic–but the bulk of what you’ll read below are my class-specific thoughts on data work and my process. You’ll see the section in header font, and the explanation below. Ready?

Introduction to the Dataset

The intention of this project was to collect data on place name in literature in order to visualize and analyze it from a geographic as well as literary perspective. I digitized and encoded three of the Icelandic Sagas, or Íslendingasögur, related to outlaws from the thirteenth and fourteenth centuries, titled Grettis saga (Grettir’s Saga), Gísla saga Súrssonar (Gisli’s Saga), and Hardar Saga og Hölmverja (The Saga of Hord and the People of Holm). I then collected geospatial data through internet sources (rather than fieldwork, although this would be a valuable future component) at the Data Service of the Digital Social Sciences Center of Columbia Libraries, during the timeframe of September 17th, 2013, to June 14th, 2014. Additionally, as part of my documentation of this data set, I had to record all of the hardware, software, and Javascript libraries I used–this, along with the mention of the date, will allow my research to be reproduced and verified.

Data Sources

Part of the reason I wanted to work with medieval texts is their open-source status; stories from the Íslendingasögur are not under copyright in their original Old Norse or in most 18th and 19th century translations and many are available online. However, since this project’s time span was only a year, I didn’t want to spend time laboriously translating Old Norse when the place names I was extracting from the sagas would be almost identical in translation. With this in mind, I used the most recent and definitive English translations of the sagas to encode place name mentions, and cross-referenced place names with the original Old Norse when searching for their geospatial data (The Complete Sagas of Icelanders, including 49 Tales. ed. Viðar Hreinsson. Reykjavík: Leifur Eiríksson Pub., 1997).

Universe

When I encountered this section of my documentation (not as a data scientist, but as a student of literature), it took me a while to consider what it meant. I’ll be using the concept of “data’s universe,” or the scope of the data sample, as the fulcrum for many of the theoretical questions that have accompanied this project, so prepare yourself to dive into some discipline-specific prose!

On the one hand, the universe of the data is the literary world of the Icelandic Sagas, a body of literature from the 13th and 14th centuries in medieval Iceland. Over the centuries, they have been transmuted from manuscript form, to transcription, to translation in print, and finally to digital documents—the latter of which has been used in this project as sole textual reference. Given the manifold nature of their material textual presence—and indeed, the manuscript variations and variety of textual editions of each saga—we cannot pinpoint the literary universe to a particular stage of materiality, since to privilege one form would exclude another. Seemingly, my data universe would be the imaginative and conceptual world of the sagas as seen in their status as literary works.
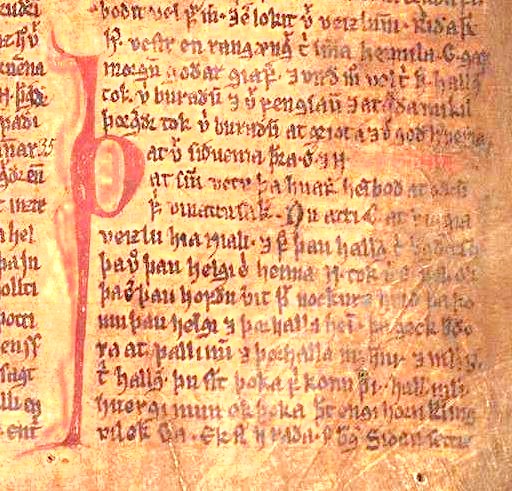
A manuscript image from Njáls saga in the Möðruvallabók (AM 132 folio 13r) circa 1350, via Wikipedia

However, this does not account for the geospatial element of this project, or the potential real connections between lived experience in the geographic spaces that the sagas depict. Shouldn’t the data universe accommodate Iceland’s geography, too? The act of treating literary spaces geographically, however, is a little fraught: in this project, I had to negotiate specifically the idea that mapping the sagas is at all possible, from a literary perspective. In the latter half of the twentieth century, scholars considered the sagas as primarily literary texts, full of suspicious monsters and other non-veracities, and from this perspective could not possibly be historical. Thus, the idea of mapping the sagas would have been irrelevant according to this logic, since seemingly factual inconsistencies undermined the historical, and thus geographic, possibilities of the sagas at every interpretive turn.

However, interdisciplinary efforts have been increasingly challenging this dismissive assumption. Everything from studies on pollen that confirm the environmental difficulties described in the sagas, to computational studies that suggest the social patterns represented in the Icelandic sagas are in fact remarkably similar quantitatively to genuine relationships suggest that the sagas are concerned with the environment and geography that surrounded their literary production.

But even if we can create a map of these sagas, how can we counter the critiques of mapping that it promotes an artificial “flattening” of place, removing the complexity of ideas by stripping them down to geospatial points? Our course text, Hypercities, speaks to this challenge by proposing the creation of “deep maps” that account for temporal, cultural, and emotional dimensions that inform the production of space. I wanted to preserve the idea of the “deep map” in my geospatial project on the Icelandic Sagas, so in a classic etymological DH move (shout out to our founding father Busa, as ever), I attempted to find out more about where the idea of “deep mapping” might have predated Hypercities, which only came out this year yet represents a far earlier concept.

I traced the term “deep mapping” back to William Least Heat-Moon, who coined the phrase in the title of his book, PrairyErth (A Deep Map) to indicate the “detailed describing of place that can only occur in narrative” (Mendelson, Donna. 1999. “‘Transparent Overlay Maps’: Layers of Place Knowledge in Human Geography and Ecocriticism.” Interdisciplinary Literary Studies 1:1. p. 81). According to this definition, “deep maps” occur primarily in narrative, creating depictions on places that may be mapped on a geographic grid that can never truly account for the density of experience that occurs in these sites. Heat-Moon’s use of the phrase, however, does not preclude earlier representations of the concept; the use of narratives that explore particular geographies is as old as the technology of writing. In fact, according to Heat-Moon’s conception of deep mapping, we might consider the medieval Icelandic sagas a deep map in their detailed portrayal of places, landscape, and the environment in post-settlement Iceland. Often occurring around the locus of a regional few farmsteads, the Sagas describe minute aspects of daily Icelandic life, including staking claim to beached whales as driftage rights, traveling to Althing (now Thingvellir) for annual law symposiums, and traversing valleys on horseback to seek out supernatural foes for battle. Adhering to a narrative form not seen again until the rise of the novel in the 18th century, the Íslendingasögur are a unique medieval exempla for Heat-Moon’s concept of deep mapping and the resulting geographic complexity that results from narrative. Thus, a ‘deep map’ may not only include a narrative, such as in the sagas’ plots, but potentially also a geographic map for the superimposition of knowledge upon it–allowing these layers of meaning to build and generate new meaning.

To tighten the data universe a little more: specifically within the sagas, I have chosen the outlaw-themed sagas for their shared thematic investment in place names and geography. Given that much of the center of Iceland today consists of glaciers and wasteland, outlaws had precious few options for survival once pushed to the margins of their society. Thus, geographic aspects of place name seem to be just as essential to the narrative of sagas as their more literary qualities—such as how they are used in sentences, or what place names are used to obscure or reveal.

Map of Iceland, by Isaac de La Peyrère, Amsterdam, 1715. via Cornell University Library, Icelandica Collection

In many ways, the question of “universe” for my data is the crux of my research question itself: how do we account for the different intersections of universes—both imaginative and literary, as well as geographic and historical—within our unit of analysis?

Unit of Analysis

If we dissect the element that allows geospatial and literary forms to interact, we arrive at place name. Place names are a natural place for this site of tension between literary and geographic place, since they exist in the one shared medium of these two modes of representation: language. In their linguistic as well as geographic connotations, place names function as the main site of connection between geographic and narrative depictions of space, and it is upon this argument that this project uses place name as its unit of analysis.

Methodology

Alright, now that we’re out of the figurative woods, on to the data itself. Here are the steps I used to create a geospatial map with metadata for these saga place names.

Data Collection, Place Names:

The print text was scanned and digitized using ABBYY FineReader 11.0, which performs Optical Character Recognition to ensure PDFs are readable (or “optional character recognition, as I like to say) and converted to an XML file. I then used the flexible coding format of the XML to hand-encode place name mentions using TEI protocol and a custom schema. In the XML file, names were cleaned from OCR and standardized according to Anglicized spellings to ensure searchability across the data, and for look-up in search engines such as Google–this saved a step in data clean-up once I’d transformed the XML into a CSV.
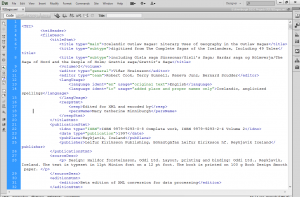
 

KinniburghXML

Here’s the TEI header of the XML document–note that it’s nested tags, just like HTML.

Data Extraction / Cleanup

In order to extract data, the XML document was saved as a CSV. Literally, “File > “Save As.” This is a huge benefit of using flexible mark-up like XML, as opposed to annotation software that can be difficult to extract data from, such as NVivo, which I wrote about here on Columbia University Library’s blog in a description of my methodology. In the original raw, uncleaned file, columns represented encoding variables, and rows represented the encoded text. I cleaned the data to eliminate column redundancies and extraneous blank spaces, as well as to preserve the following variables: place name, chapter and saga of place name, type of place name usage, and place name presence in poetry, prose, or speech. I also re-checked my spelling here, too–next time, no hand-encoding!


KinniburghCSV

Here’s the CSV file after I cleaned it up (it was a mess at first!)
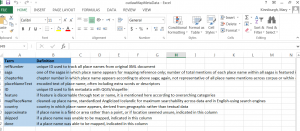
KinniburghCSVKey

I saved individual CSVs, but also kept related info in an Excel document. One sheet, featured here, was a key to all the variables of my columns, so anyone could decipher my data.

Resulting Metadata:

Once extracted, I geocoded place names using the open-source soft- ware Quantitative Geographic Information Systems (QGIS), which is remarkable similar to ArcGIS except FREE, and was able to accommodate some of those special Icelandic characters I discussed earlier. The resulting geospatial file is called a shapefile, and QGIS allows you to link the shapefile (containing your geospatial data) with a CSV (which contains your metadata). This feature allowed me to link my geocoded points to their corresponding metadata (the CSV file that I’d created earlier, which had place name, its respective saga, all that good stuff) with a unique ID number.

Data Visualization, or THE BIG REVEAL   

While QGIS is a powerful and very accessible software, it’s not the most user-friendly. It takes a little time to learn, and I certainly did not expect everyone who might want to see my data would also want to learn new software! To that end, I used the JavaScript library Leaflet to create an interactive map online. You can check it out here–notice there’s a sidebar that lets you filter information on what type of geographic feature the place name comprises, and pop-ups appear when you click on a place name so you can see how many times it occurs within the three outlaw sagas. Here’s one for country mentions, too.
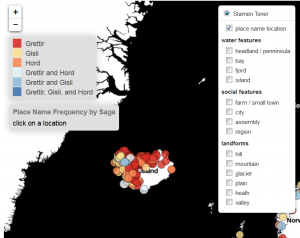
 

KinniburghLeaflet

Click on this image to get to the link and interact with the map.

Takeaways

As the process of this documentation highlights, I feel that working with data is most labor-intensive when it comes to positioning the argument you want your data to make. Of course, actually creating the data by encoding texts and geocoding takes a while too, but so much of the labor in data sets in the humanities is intellectual and theoretical. I think this is a huge strength in bringing humanities scholars towards digital methodologies: the techniques that we use to contextualize very complex systems like literature, fashion, history, motherhood, Taylor Swift (trying to get some class shout-outs in here!) all have a LOT to add to the treatment of data in this digital age.

Thank you for taking the time to read this–and please be sure to let me know if you have any questions, or if I can help you in mapping in any way!

In the meantime, stay tuned for another brief blog post, where I’ll solicit your help for the next stage of this project: visualizing the imaginative components of place name as a corollary to this geographic map.