I was very taken with Lev Manovich’s article, “How to Compare One Million Images?”, on image visualization that dealt with ImagePlot and its use in his project, although at that time I wasn’t thinking of using it the dataset “play” project. I am a visually driven person, and spend quite a bit of time playing around with images. Similar to those who relax with books, I curl up with images, and spend a lot of time gazing at pictures. And, also an almost equal amount of time searching for them. So, with my new-found awareness of data, I began wondering if my preferences could be quantified, and use the resultant measures as search criteria?
So with the dataset project in mind, I went back to Manovich’s article and read it again to get details, which directed me to the Software Studies website to download ImageJ. I then downloaded the macro, ImagePlot, required for image visualization. After installing it in ImageJ, I set about finding its requirements for visualization from the software documentation. All that ImagePlot required was an image collection with associated metadata. I put together a set of 135 images from my personal collection after sifting through 600 odd images. I took particular care to include only those that I really liked, so the results would be meaningful.
As ImagePlot automatically scales the images to an uniform size, it was enough to just pull all the pictures together into a single folder. (ImagePlot documentation does mention that such a step is not required, as it is capable of handling images stored at different locations in a computer.)
Now that I had the image set in place, I went back to the documentation to know what format was required of the metadata, which happened to be ‘delimited tab text’. At first, assuming the metadata had to manually assembled, I spent some time creating a trial file for 20 images in that format. Once it became apparent this would be time consuming, I went back to the documentation and came to know that ImageJ does ‘batch’ (measuring multiple images in one step) image processing and measuring, the results of which are stored as a .csv file by default. Just choose the features that are to be measured (image brightness, gray values, etc.), click on ‘measure’ and, in one stroke, metadata appropriate for the image visualization is created by ImageJ itself! Overjoyed and very appreciative of ImageJ, I proceeded to convert this .csv file to the ‘delimted tab’ .txt format in Excel and was finally all set to go.
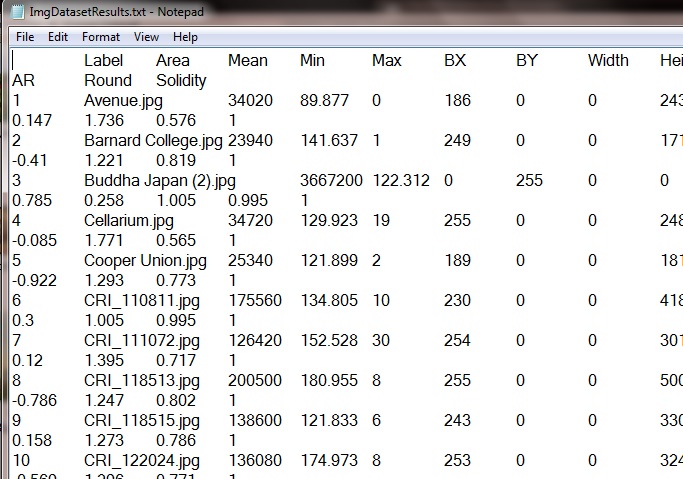
Snapshot of Metadata in Delimited Tab .txt format
I chose to measure mean gray value (y-axis) and intensity (x-axis) of the images and plotted the values with the following results.
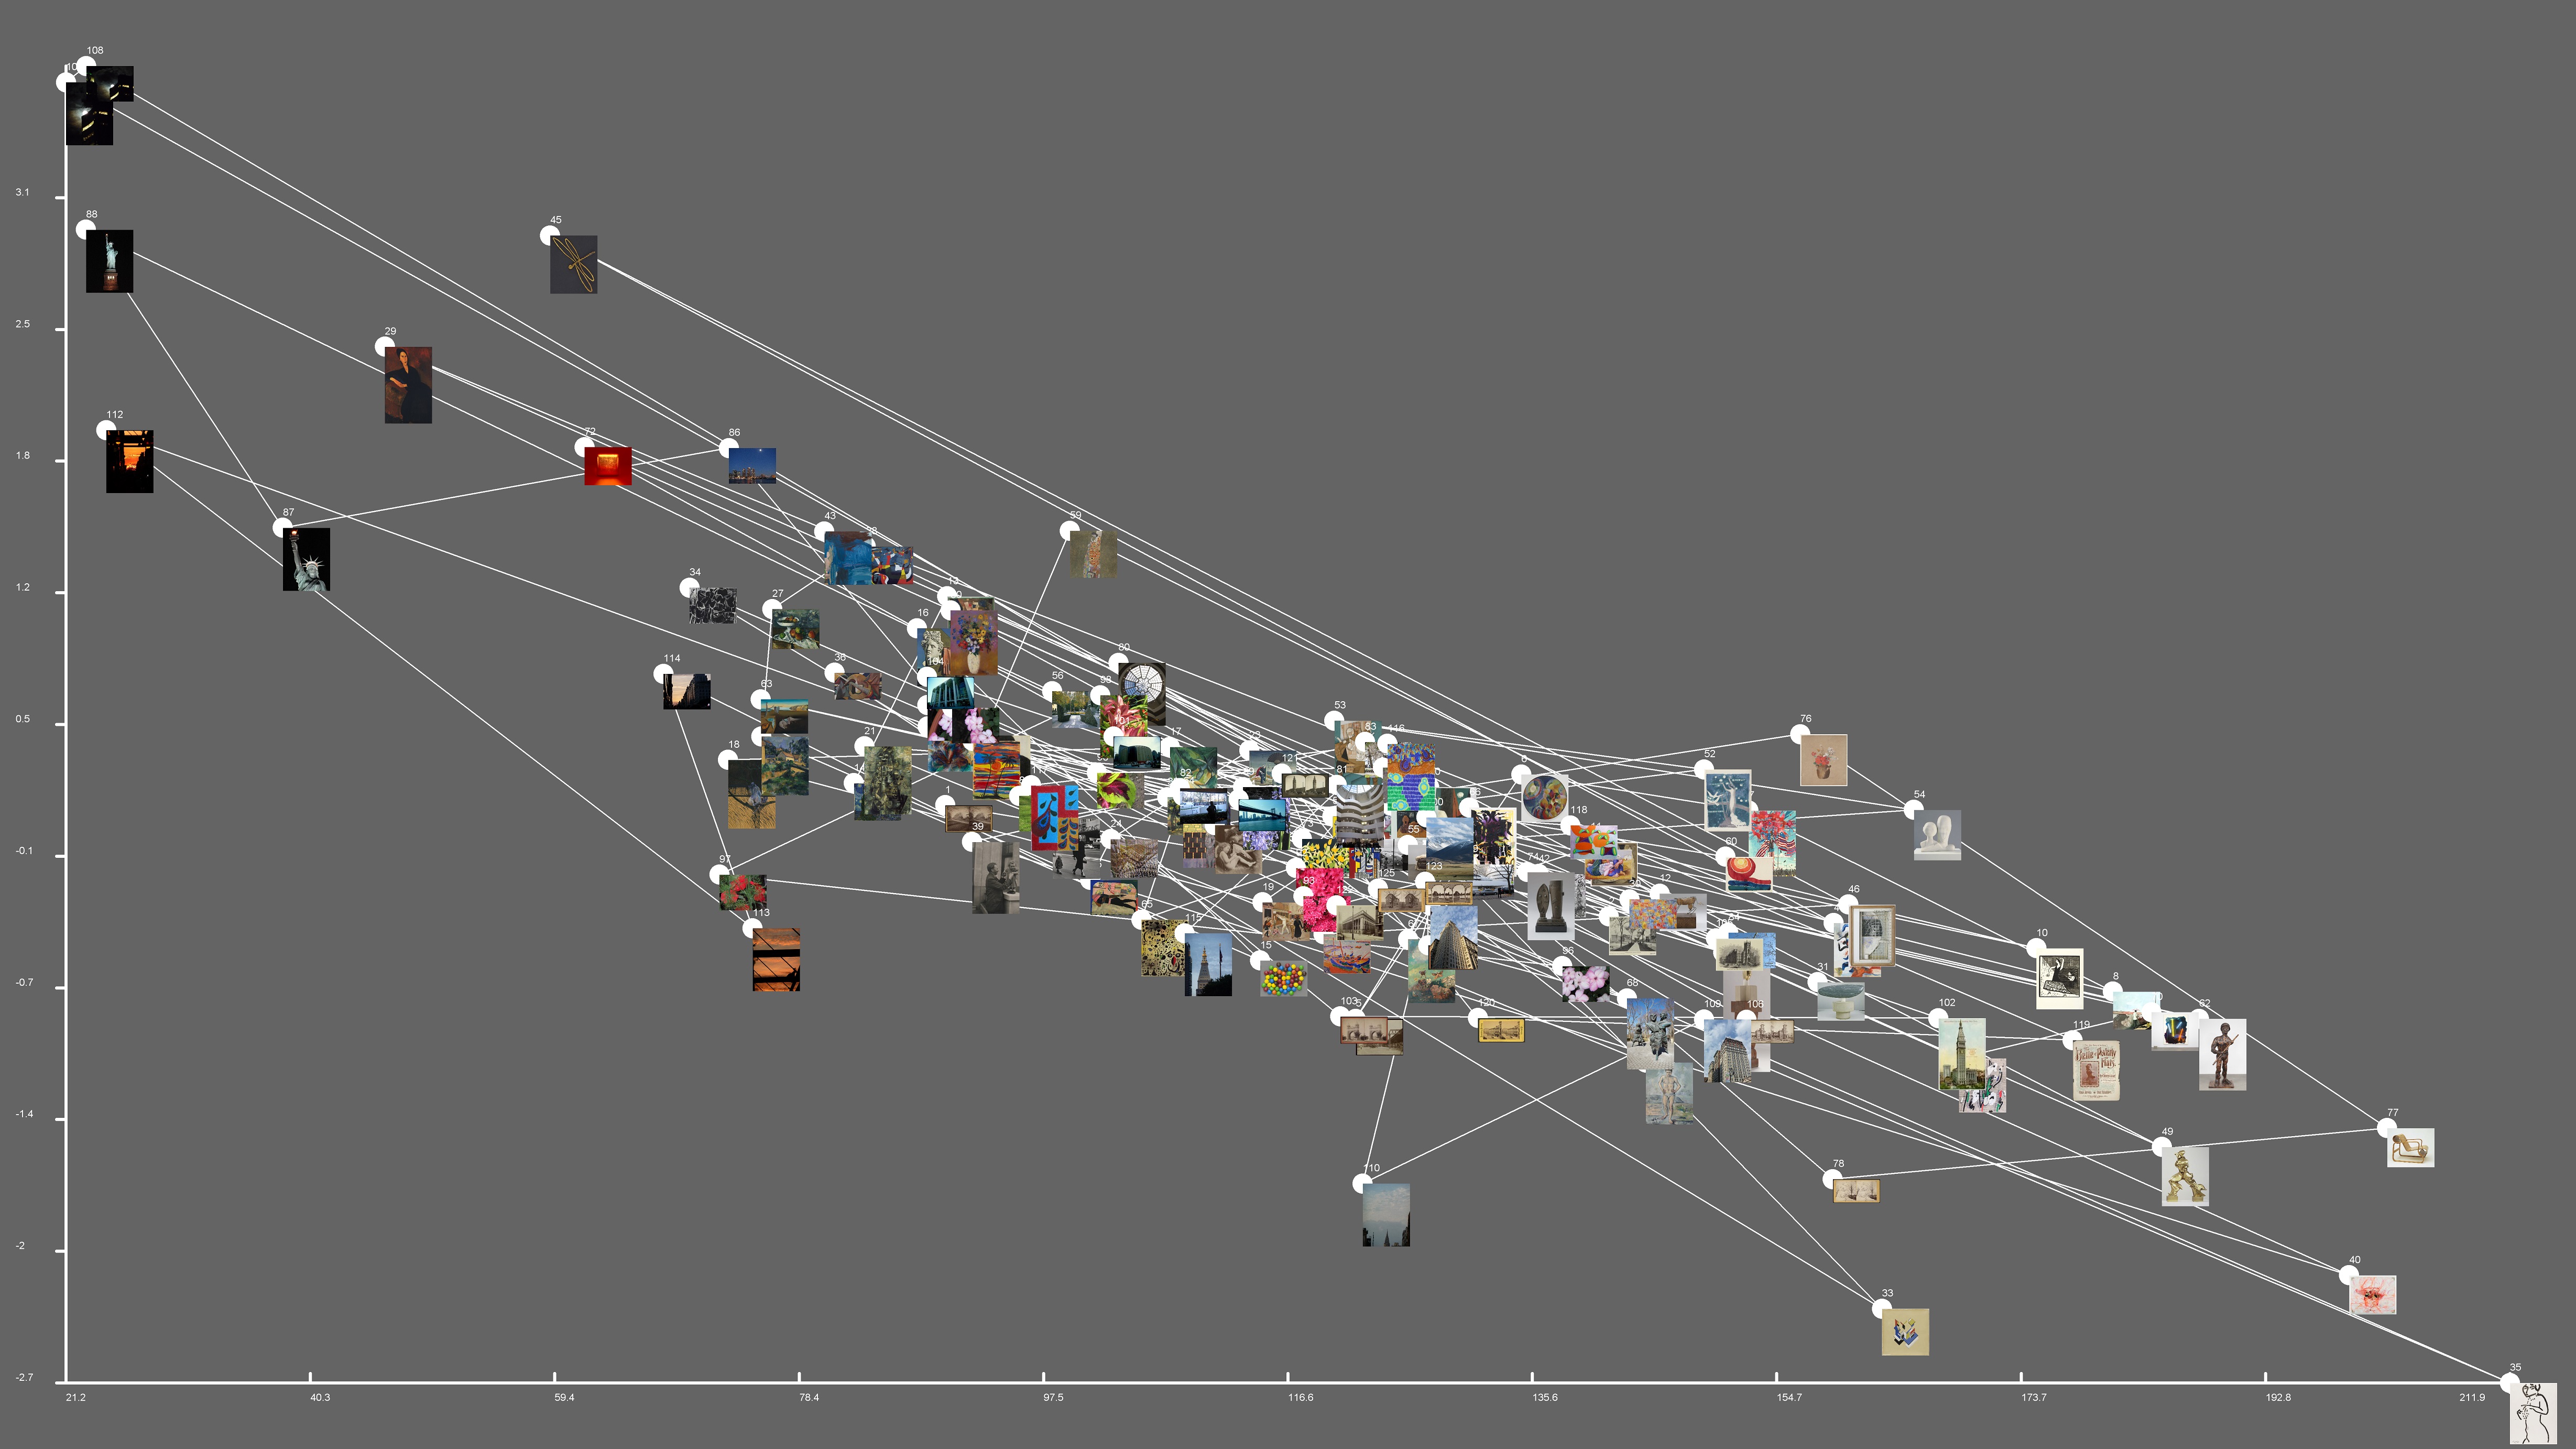
Through the visualization, I was able to see the range of gray values and intensity my images possessed. It seems I prefer images that are bright with less grayness, and of moderate intensity. Most of the images are of medium to low gray values, with very few in the high gray and high intensity category. The lines link images of similar characteristics and show how the images relate to each other.
As a next step, I intend to pursue animated visualizations now that I’m familiar with the visualization process. The biggest revelation for me was the documentation that accompanied the software. I’d always assumed that answers had to be found elsewhere from knowledgeable users, but most of my questions were answered by the documentation itself. Worked out sample projects that accompanied the software were helpful as well. These resources gave me the confidence to approach the project and fix errors in processing. Also, understanding data formats and creating metadata for the images were equally empowering.
So, going back to my earlier question – can my image preferences be quantified? Yes. But, I am yet to figure out how to use these values as search criteria for image collections. That, is where I go from here.
ImagePlot and ImagePlot Documentation can be found here –
http://lab.softwarestudies.com/p/imageplot.html
https://docs.google.com/document/d/1zkeik0v2LJmi1TOK4OxT7dVKJO7oCmx_fNP8SYdTG-U/edit?hl=en_US&pli=1#