Author Archives: Julia Pollack

CUNYcast last week

We are excited to end the year with a great presentation! and great group of classmates!

During the semester we:

  • Successfully changed project direction
  • Negotiated group schedules
  • Created our own work flow communication process
  • Learned from project complications

Our group was interested in how to work with audio in a DH capacity and we have created a process to work with audio with a community of users!

This last week has concluded work on final paper and presentation and continued touch ups to the websites functionality.

guh

With continued help from from prof Hickman we continue to step further and further forward with web functionality.

guh2

And with some helpful class members we move forward with a better more mobile site.

A warm thanks to everyone!

See you all Tuesday.

CUNYcast weekly update

CUNYcast has hit the ground running with great work all around.

Outreach & Management:

This week outreach set up an amazing tabling event! We received over 30 signatures from people who are interested in casting! This week Tuesday evening we will be hosting a workshop for interested casters!

Developer:

To get our front-end Calender and show info widgets working, we had to do two things:

Define sourceDomain: The installation guide for the widgets does a poor job of explaining this, but the sourceDomain is the site which you are pulling information from. The tutorials we were using stated that source domain should be your public site address, but no, it actually isn’t. Our public site address is cunycast.net (as in, the site we are sending information to) and the information we’re getting the information from to fill the widgets is airtime.cunycast.net (the proper sourceDomain).

Remove i-frame: Airtime recommends putting its widgets in an iframe, which stands for inline frame.  an inline frame allows you to embed another html document on to a page. As such, they let you define and manipulate rules within a specific section of your page. That said, they are finicky and hard to configure, in that not only do you have to figure out the proper dimensions for the frame on the page, but you also need to work between two .html to get it working properly. As such, we took the information from the i-frame.html and just embedded it in the <head> and <body> of our page.

Designer:

The website has been flushed out we now have 5 pages:

today

today1

today2

The FAQ list is rounding out a lot of uses for the site and the Process page is going to be a great space for us to manage our longer form tutorials and our project development. This week will formally document our user testing and make the necessary changes to our site. This week we will perform 5 user testing experiments. We will open the website for a subject and ask them to respond. We will then ask them to use the tutorial page specifically, and respond. This should be a great way to finalize the language about our project.

YOU CAN NOT SEE THE CHANGES LIVE YET but… you will be able to see them Monday!

yay!

Stay tuned and I will update this post when the pages go live!

CUNYcast Update week 5

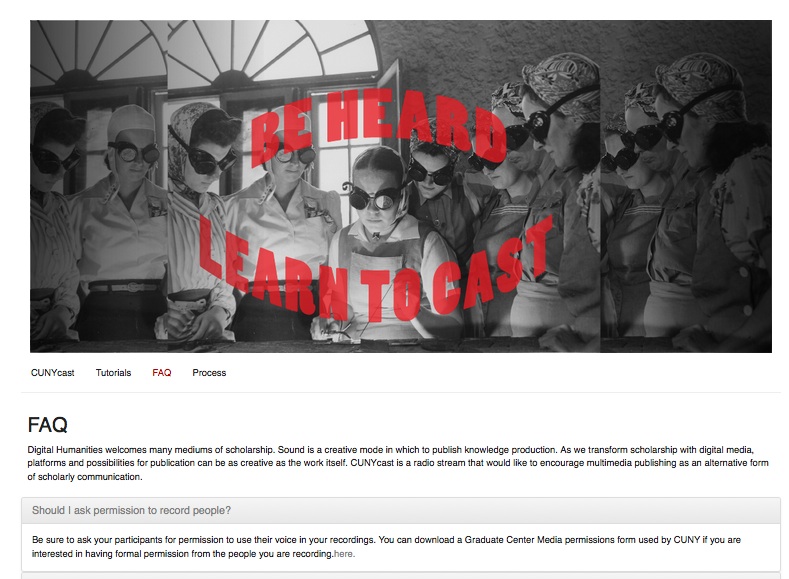
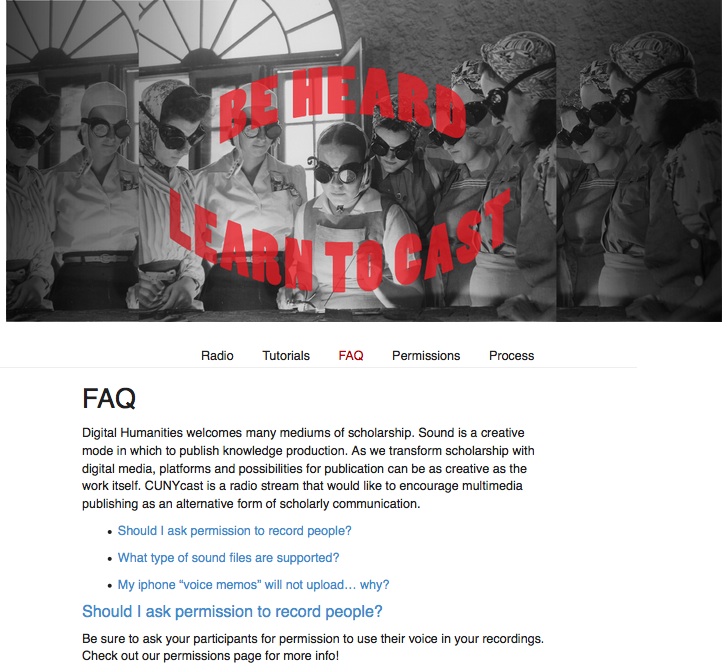
SHOUT IT OUT WITH CUNYcast!

CUNYcast is moving forward and expanding our knowledge of the technical requirements involved in online radio broadcast. This week major strides were taken in outreach and development.

  • Contact was made with support and specialty knowledge in online radio broadcast technology (Mikhail Gershovich)
  • Reclaim hosting server space was finalized
  • Icecast and Artime were uploaded to server space.

THE MINIMUM VIABLE PRODUCT (MVP)

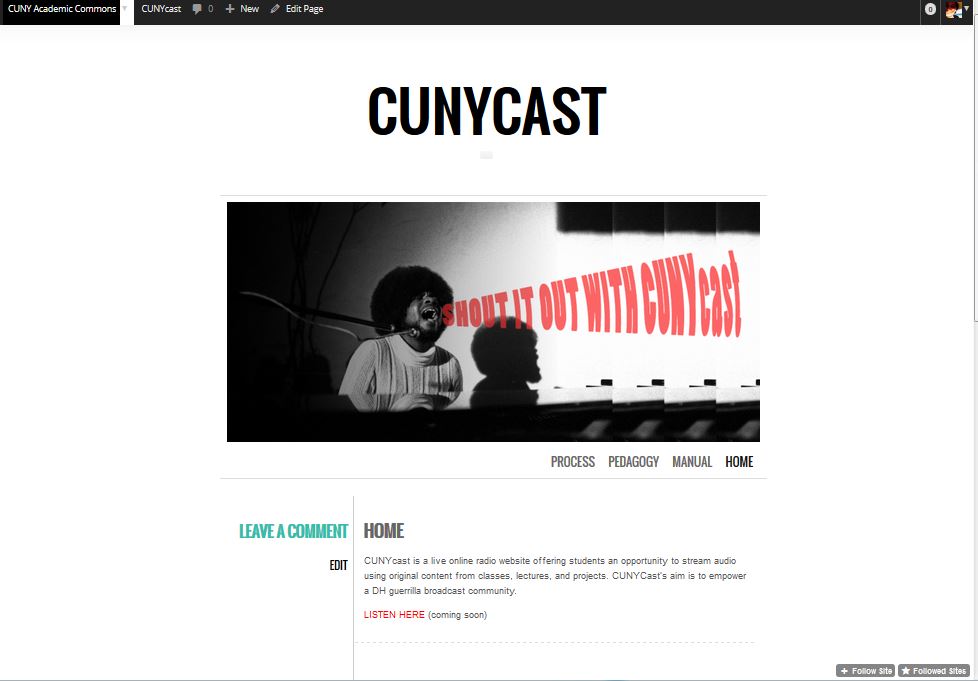
CUNYcast is a live online radio website offering students an opportunity to stream audio using original content from classes, lectures, and projects. CUNYCast’s aim is to empower a DH guerrilla broadcast community.

CUNYcast will reach out to the GC through an academic commons page that will link users, listeners, and curious DHers to our CUNYcast web presence. The CUNYcast web page will have a space for listeners to listen to the live streaming CUNYcast content. It will have a space where users may learn how to access the CUNYcast live stream and upload their own content. CUNYcast is designed to inform and inspire its users, to facilitate this experience CUNYcast’s web page will house a manual that will empower user’s to add their own content to the CUNYcast live streaming radio and inform them on how they could create their very own digital live stream radio channel. A portion of the manual will help users learn how to create their own audio content if the wish to explore a more polished radio stream format.

As an added bonus the CUNYcast website will have links to educational audio content and pedagogy surrounding teaching practices that utilize audio creation as mode of production.

Technical specifications for MVP

The technical map of CUNYcast lays in the Icecast media server and the Airtime client used to manage media on the media server. This back end structure will be given its public face on our website and our cuny commons presence.projectmap03-02-2015

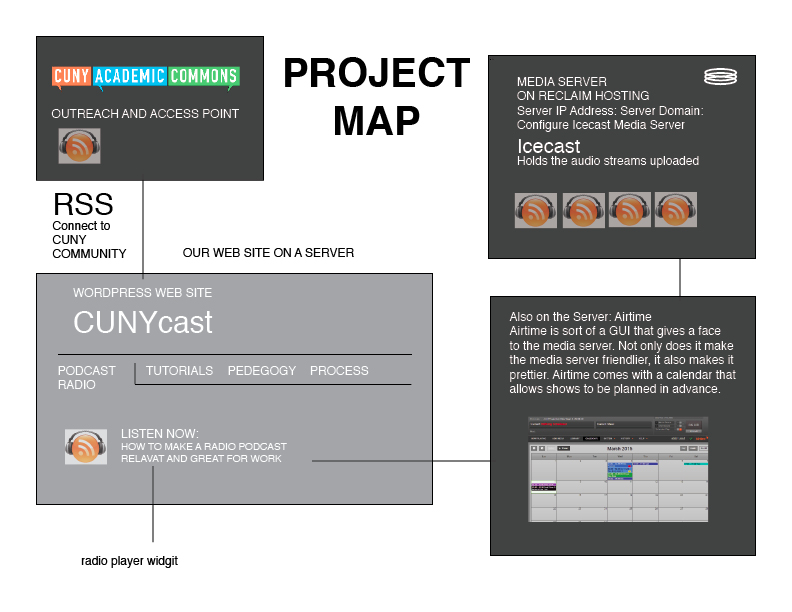
Outreach: Report of activities to date

How To Succeed Even When You Fail

Spring semester 2015. Our Digital Humanities class broke into teams. We were only mildly anxious. Like the television show, “Shark Tank” which features new pitches for products and services each week, we were convinced our ideas were sound and that we could excel. The thing was, within just a few days we started to drown. Instead of devouring the material and spitting it back out for human consumption, we started sinking in a sea of possibilities. No tech geeks on our team. Just dreamers. That didn’t stop us from grabbing at every idea that seemed to float.

But, wait, our group of four people diminished to only three by week two. Man down. He disappeared and dropped the class (we wished him well). The three of us had to take a good hard look at the CUNYcast concept and decide what would assure our chances of survival. (Think of the music to Jaws playing underneath these words).

We took our overblown idea of a RSS-feed calendar linked into the CUNY system, that would record remotely via an app, after two afternoons of staring at code and realizing that by the time the project was due, we’d maybe have gotten through a couple of introductory tutorials. There was no way any of us would be coding experts in 12 weeks.

We trimmed the fat. Bit back with strength and vigor, and began on the current instantiation of CUNYcast: a live online radio website offering students an opportunity to stream audio using original content from classes, lectures, and projects. Our professors urged us to aim outside the box and empower an entire DH guerrilla broadcast community at the Graduate Center. Reporting in on week 4 and things are going swimmingly. We’ve gelled as a team and we’re optimistic.

We are not afraid anymore We are not afraid anymore – even if we should be.

Development:

This week, the goal was to configure an Icecast Media server in a local environment.Airtime and Icecast were configured on our server when we received the server configuration thanks to Reclaim hosting.

Icecast is (again) a media server. When you have an online radio station, the media server is where the audio/video lives for the duration of the stream, sort of an intermediary between the streamer (host machine) and the watcher (listener). Airtime is sort of a GUI that gives a face to the media server. Not only does it make the media server friendlier, it also makes it prettier. Airtime comes with a calendar that allows shows to be planned in advance.

One interesting thing about media servers, is that if someone has the access information to an Icecast server (ds106 allows their’s to be public, as will we, that’s kind of the point) they can use broadcasting programs to take over the station. If another person tries to take over the station when a show is going on, they’ll be met with an error. Airtime simplifies this with the above-mentioned calendar feature, as it allows users to see when shows are planned, and as such, schedule their planned broadcasts around that. Of course, this also allows for anarchy…

Bugs! The Icecast Server worked perfectly. We were able to access it via broadcasting software (Mixxx) and pick up that broadcast via VLC and browser (the address currently being cunycast.net:8000/live, kind of ugly) . However, Airtime specifically had some trouble connecting to our Icecast server, even after multiple troubleshooting attempts. When transmitting via Airtime, a connection could be established to the Icecast server for roughly ~10 seconds before falling flat, despite Airtime claiming the show was still airing. I hate it when machines lie to me. Anyway, after doing some GoogleFu I came across a thread on the SourceFabric forums (SourceFabric developed Airtime) about this exact problem. The fix stated in the thread claimed that  I needed to restart certain Airtime services via commandline using the “sudo” command. Sounds scary. Because Airtime was installed for us, I was a little worried about messing it up, fearing that I would have to reinstall things that I do not understand. However, we were able to fix the bug more easily, by switching the broadcasting format from OGG Vorbis to simpler MP3 format.

development goals include:

  • Figure out how to interact with Airtime via command line (need help from Digital Fellows here)
  • Bring the backend media server to the front ASAP such that we have a simpler/prettier way for users to tune in.
  • Implement an AutoDJ to play over the station and maintain it when no broadcasts are coming in (this is where we may need to talk to a ds106 person).
  • Determine how incoming users will be able to manipulate/interact with Airtime.

Design:

Slow progress is being made constructing the structure and elements to the CUNYcast web presence using Bootstrap. The pre organized Java and CSS allows for immediate product but there is still a bit to understand about the addition of and linking to media.

The CUNYcast Academic commons site is being designed to mirror the CUNYcast website.

CUNYcast

The guide on how to create websites is being updated to make sure that the CUNYcast manual evolves as the project evolves.

Journal #1 Julia

I am excited and anxious for this process.

It was really nice to see all the familiar faces from DH1. The project I put forward for DH1 is something I will be pursing on an individual level. I think using DH in a preformative space to help me construct my artwork will push my work in ways that I have yet to know and understand. But this work is dependent on travel and is not appropriate for a group project it is to self serving. I will have no idea what information I have until after I take my trip and sift through my collections.

I am not one to get anxious in class, I love everything about school, work shopping, talking, and getting through ideas. But I will admit that I am anxious to know how this DH class project will move forward. My favorite teachers, teachers I base my own teaching ideals on, have always had  skills components to class and a theoretical components to class. I appreciate projects that have something to show at the end. I appreciate final projects that have a bit of showmanship and theater. Even if a project does not function in exactly the way it set out I like projects that have finished edges.

I like to have a plan an idea of the knowns and unknowns and I am anxious to know what I will be working on (besides my own side projects).

my goals for this class are to expand my technical DH skillset. I hope to learn enough about this workshoping teaching process to find ways to implement this kind of project based learning in my library profession. Digital Humanities  librarian is a job that has hit the librarian list serve, I have an idea about how I would brand my skillset for a position like this and there are some skills that I want to shore up before I claim this job title. This class will be  chance to showcase examples of my DH deliverable.

Encourage Pitches: U People Rule

I would like to send encouragement to some of the pitches that I liked in class.

@James I am a podcatsting nerd, I love em, I am always thinking about ones I should make. I imagine a kind of protocol that would make this idea very streamline and easy for prof’s to use. maybe like an app that would record and add intro’s automatically and upload seamlessly.

@JoJo I love this idea. I have told you before I imagine a very abstract digital space where sound and artifact behave in chaotic or beautiful ways. A kind of antithesis to ansestry.com. This project would be less about which king you are related to and more about a space to let memories stream around. kinda like the 9/11 sonic memorial archive.

@Kelly This project is important and good and practical and something that we could make and be able to distribute. It would be good for my professional development 🙂

@Tessa I like the idea of a collection for web trends. I am sad that RSS seems to be less than cool, I like Pinterest but it is SO proprietary (and full of weddings). I want to think about this project a bit more, what could it be? what could it do? how could it function?

@Chris V I mean I want to see what happens with this.

@Joy I am so into mother studies and alternative spaces for scholarship and history. My interest in this is about the content like @Sarah and @Juliana

@Liam I think social citation could be fun I think we should talk about it

I was gonna try to keep it to 4 oops (sorry profs), but I would be happy to pre brainstorm before class

@ http://pixgood.com/cat-computer.html

#skillset @Julia Pollack

#skillset @Julia Pollack

Hi Friends!

Project Management: I am good at leading meetings, but I would prefer to be a great group member rather than the project manager. (I would love to help the group manager with presentations, I am a great public speaker)**

Outreach: I am a terrible speller, sooooooo someone else should tweet. But, I can make pretty pics to help with outreach materials. **

Developer: I am learning Some codes and I would like to push myself closer to this identity. I took an R class with Prof Manovich. I have hashed around with some visual tools. I would love to play around with Java. As I am reading people’s #skillset posts it seems like everyone feels a similar trepidation with the term developer. If I wear the label I would love some team buddies to work with. If I wear a different label I will be there with the developer side by side because this is a part of my academic identity I wish to focus on and develop.***

Designer: A am good at Photoshop and InDesign. I can edit video’s, and audio. I am proficient at a variety of web publishing platforms wordpress etc.. Also, I like visuals I find that I build visual models before I do anything else in a creative project. I feel as if I teach UX in library Info sessions, I am regularly leading workshops while asking students about usability and interface design.****

Other: Lookin up articles, encouraging others, problem solving, eating snacks, makin cat memes.

Small Data Viz

I am interested in visualizing information, well… I am also interested in visual information, and visual literacy.

I swear I am creative. and visual. 🙂

I work at bronx Community College and I have been trying to engage with the campus history. Bronx Community College used to be NYU at the turn of the century, NYU constructed a Hall of Fame for great Americans. It is a stone colonnade and every few years they had this nationally published event to induct people into the hall of great americans. People from all different fields of study all great for being Americans. There was a democratic-ish nomination process that is VERY well documented and then the Hall of Fame Delegates had the final vote about who got inducted. The last person was inducted in the 1970’s right after the campus was sold to CUNY from NYU to become Bronx Community College. Here is a link to the google doc for all the data I collected about each hall of fame inductees. I created a tiny data set made of all the information we have in different pamphlets about the Hall of Fame busts.

My students have to write papers about the hall of fame and find lots of Biographies about the Hall of Fame people, and sometimes they come to the desk and they are like “which one is the coolest? I dont want a lame person.” I thought I could maybe make an infographic that gives you some sort of overview of the hall of fame and the inductees. There are quite a few busts in the hall of fame that leave the viewer wondering why this person was considered Hall of Fame worthy.

I started by separating the figures by subject.

Then I thought I could build something more complicated. This PDF. is supposed to be 2ft by 3ft thats why you have to zoom in to see stuff. I built it with layers in Indesign.

I like this size of data set because it is manageable and I think it gives some real information about this historical architectural spot. This historical landmark represents a national identity that is defined mostly before the second world war. The people who were involved with this landmark were thinking about this country in terms of the civil war. That just blows my mind. Looking at the life spans of each inductee tells a story about how people at the turn of the century were mapping out this nations history and identity. Building this visualization from this little pamphlet dataset allows me to speak very assuredly about the history of this landmark.

LOOK HERE FOR MY POSTER:poster infographicidea

Here is the big file: poster infographicidea

Rrrrrrrr

I was a bit overzealous in my first semester as a MALS student and I am taking Prof Lev Manovich’s Data Visualization class. I saw his name in the course scheduling and I had a mini heart attack. “I COULD TAKE A CLASS WITH LEV MANOVICH!!!” this was my reaction. I had to do it. What if the course was not offered another semester and this was my only chance?!?! I have been reading his work 4ever.

I am learning R but mostly it feels like I am having mini panic attacks when I cannot get the console to respond to anything I type in, then I get so excited when I make anything work I think I have conquered the world, then I got to class and all the computer science boys have made these beautiful amazing visualizations, and I am back to panic attack mode. soooo get excited! this could be your future 2!

As a side note, as we move forward I would like to have an in person R working group that involves drinking and swearing. srsly. email me.

One data set we are working with is a very rough data set of Instagram uploads for last years month of may. It has over 2 million entries so your computer has to have lots of memory or it will not even look at the data. Data in R can be numeric (12) or it can have characters like “spring time.” Sometimes R can read numbers as characters and count characters as numbers. So yeah. blarg. This particular data set only has two numerical values latitude and longitude. It also has instagram usernames, URL’s for the pic posted, #’s, Instagram Id’s, and date and time posted (but not numerically instead as a character string).

I am still struggling with the most basic logical arguments in R. Assigning data to variables and then accessing those variables and gathering information in various formats that can turn into graphs. I spent about an entire week unable to even load the data into R. That felt very dumb. gradually I realized my 7 year old macbook pro did not have the space or steam for these 2 million datas. Then I rented a clunky old dell from my library, I struggled more with uploading my data into R until I realized that directories in mac computers have / forward slashes and directories from windows machine have \ backslashes so I was literally just writing the wrong file name a million times. AHHHHH

Next thing to do; stay home from work to watch a million youtube videos because I do not want to email people about my problems with R I need to listen to them explain to me how to do things (hence my desire for an In person drinking R group). learning this language is pretty interesting in itself, I realize that lots of learning I do is all a similar kind of learning, but sometimes you really have to examine how you absorb information best when you are taken back to that awful feeling of childish bewilderment.

Right now I can only make R look at the numerical parts of the data. I am confused about how to command counting of the character data and then graphing that counted character data. For example a lot of the images probably have a  #NY associated with the data. If I could count this and then associate it with the latitude and longitude I could graph it. I will figure this out.

I am instructed to be creative, but I feel like a bit of a moose fumbling around in this R language, it is difficult to be creative when I am still trying to type sensical strings of commands in R that don’t just bring back error messages.

Here is a mediocre graph. I have plotted the lat long of a sampling of 20,000 Instagram uploads. the third variable I have added to my graph is the type of upload, image or video. This graph is not very creative. But Instagram uploads make the shape of Manhattan! We are our geography!

20,000 random sample