Author Archives: Kelly Marie Blanchat

TANDEM project update

The code merge was completed and tested on two local machines and uploaded to the server at Reclaimhosting.com. According to Tim Owens at Reclaim, the necessary Python packages were loaded on the server, but the code cannot find three of them, so, as of this date, the code has not been run (Note: running this code on the server is an interim step to verify that the core logic of the text analysis and image analysis works properly). However, the server was built out so that the demonstration Django application launches successfully. Unfortunately, once it launches, some of the pages cause errors as does any attempt to write to the database. Our subject matter expert has been contacted to help debug these errors.

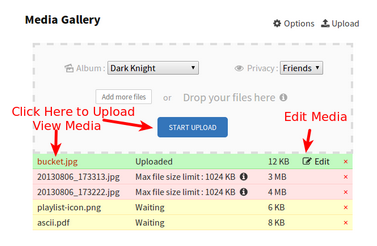
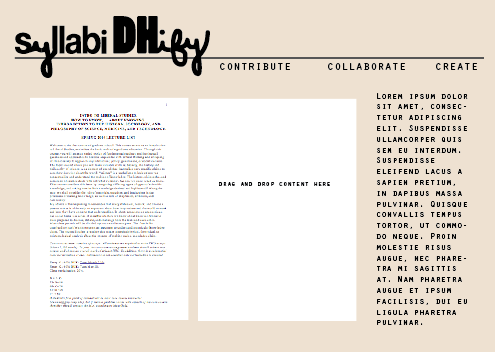
On a separate development path, multiple members of the team are working on building the Django components we need to turn the analytics engine into an interactive web application. Steve is working on linking the the core program to a template or view. Chris, Kelly and Jojo are working on designing and building the templates in a Django framework. Current UI/UX concerns involve potential upload sizes combined with processing time, button prompts that launch the analysis, and ways to convey best practice documentation so that it’s clear, concise, and that it facilitates proactive troubleshooting. The next part of this process will be to address the presentation of the final page, where the user is promoted to download their file. This page has great potential to be underwhelming, but there are some simple features we can apply to jazz it up, such as data visualization examples and by providing external links to next-step options.

On the outreach front, Jojo went to a Django hacknight Wednesday to get a handle on people building Django apps. She made contact with several new advocates in addition to garnering further support from Django Girls participants web developers Nicole Dominguez and Jeri Rosenblum, as well as hacknight organizer Geoff Sechter. The new contacts include Michel Biezunski. He seems like he could help. And has used Django to upload and redistribute files for his app InstantPhotoAlbum. So he could help when we work on figuring out potential options for placing and giving back data.

Last but not least, Chris attended a meetup at DaniPad NYC Tech Coworking space in Queens, NY this past week. There, he met a handful of Python developers who had insight into working with Django based web-apps. Commercial uses for TANDEM-like were brainstormed and people responded with interest in testing a prototype. Along with academic beta-testers, some of these people will be included in the contact list when TANDEM is deployed.

week 6 project update / TANDEM

Development

On the image processing side of things, Chris has identified the syntax for generating our key values. Now we are working toward stitching the pieces together in a way that makes sense for our output. The extreme minimum of computer vision is accessible via OpenCV and while the possibilities are tantalizing, we have continued to keep a direct focus on the key pieces we need to access for the mvp. TANDEM is still on track.

We have also begun to reevaluate our progress. To do so, we created a new list of dev tasks that range from bite-sized to larger steps so we can visualize how much further we have to go. Steve has been doing a great job of keeping track of progress and using git for version control of his scripts.

In addition we successfully implemented a routine to convert PDF to TXT. Input files are screened by type. If they are JPG, PNG or TIFF, they are passed to Tesseract for OCR processing. If they are PDF they are passed to a PDFMiner routine that extracts the text. In each case the program writes TXT files to “nltk_data/corpora/ocrout_corpus” with a name that matches the first order name of the input file. The latest version of the backend code is here: https://github.com/sreal19/Tandem

Web functionality remains problematic. Most effort this week has been merely trying to get through the Flask tutorial.

To end on a positive note, developmentally, good progress has been made with Text Analysis processing. We are computing the word count and average word length for a single page. The program also creates a complete list of words for each input file. In the very near future work will be completed to create a list of unique words and the count of each. The team must make a decision about whether to strip punctuation from the analysis, since many of the OCR errors are rendered as punctuation.

Design/UI/UX

We’ve been working to identify the ideal UX functionalities for javascript. Most of this was fairly straight-forward, such as giving the user the ability to browse local folders & view a progress bar of the upload/analysis. It has been difficult to locate a script to produce error messages. Searching for anything involving “error” in the name retrieves a different type of request, and “progress” only gets to half of the need.

For instance, we had discussed having the ability to let users identity upload/analysis errors by file, either with a prompt on the final screen or with indicator text in the CSV output. Such a feature will provide the user with the ability to go back and fix the error for 1 file, versus having to comb through the entire corpus and re-uploaded. An example of how this would look would be something this, with text & visual cues that indicate that  which file needs review:

an image of suggested UX functionality to identify errors in file uploads

There is some documentation on Javascript progress events and errors, but we need to need to discuss how it could be employed for TANDEM, and whether its necessary for the 0.5 version.

Outreach

Twitter continues to be the primary platform for outreach. While #picturebookshare continues to chime away, we are also now using it to generate research ideas for potential TANDEM users. Fun distant futures for TANDEM might involve the visual trajectories of various aspects of books: visuality of covers or book spines, as well as the visual history of education materials.

Jojo spoke with Carrie Hintz, who has is starting a Childhood Studies track via the English Department, to see if she knew anyone studying illustrated books at the GC. She has no leads yet, but said come the fall she would have a better idea of people interested in TANDEM. Meanwhile, Long LeKhac, an English PhD at Stanford, was giving her a sense of the DH scene there and said he would ask around the DH community beyond Moretti’s lab. Jojo is in the process of devising outreach to text studies experts — Kathleen Fitzpatrick at MLA, Steve Jones — and folks in journalism — Nick Diakopoulos, NICAR and Jonathan Stray, per Amanda Hickman’s suggestion. Keep on keeping on — keep the tweets t(w)eeming.

skillset — Kelly

With my professional position ingrained in technology, my primary skill set involves digital knowledge organization, in addition to remote/online collaboration and project management.

With that said, I’m interested in branching out to expand on my design and web development skills.

I have experience in designing for print and the web — illustration (by hand, Adobe Illustrator), color theory, CSS/XHTML, layout design (InDesign) — both for myself (fine art, and customizing websites and blogs) and professionally (for library and society websites). I would like to increase my coding abilities; right now I get by with what I know, and am able to use Internet forums to fill in any gaps.

syllabi DHify (pre-pitch)

In preparation for Wednesday’s class, here’s my pre-pitch for Syllabi DHify:

Screen Shot 2015-02-08 at 12.20.05 PM

A syllabus should be a living document that evolves as the semester progresses. However, in practice a syllabus becomes quickly outdated — from the moment a single student scrawls marginalia onto a handout, indicating that something was incomplete, something had changed.

At the most basic level, Syllabi DHify will be a platform for both students and professors to quickly access and update course syllabi, removing the need for erroneous print-outs or Word documents shared via e-mail.

For teaching professionals Syllabi DHify will go a step further by providing a space for active pedagogical collaboration. Users at this level will have the opporutnity to share existing syllabi, collaborate with peers, and re-use shared content. Syllabi DHify will facilitate the incorporation of new pedagogical methods across disciplines. The platform itself will be an exercise in Digital Humanities methods and practices, drawing on the open sharing principles behind Massive Open Online Courses (MOOCs) and Open Access (OA). As such, it will provide provide teaching professionals not familiar with Digital Humanities a means to incorporate its technological, collaborative, and systematic practices into existing student course work.

Syllabi DHify aims to improve upon the way in which information is shared, allowing for a more fluid, collaborative learning experience.

If you’re interested in sharing the work of DH to the larger knowledge community — come join me.
If you’re ready to see higher education move forward — come join me.
We can take our methods from DH and share it. With anyone.

it’s “BIG” data to me: data viz part 2

image 1: the final visualization (keep reading, tho)

Preface: the files related to my data visualization exploration can be located on my figshare project page: Digital Humanities Praxis 2014: Data Visualization Fileset.

In the beginning, I thought I had broken the Internet. My original file (of all the artists at the Tate Modern) in Gephi did nothing… my computer fan just spun ’round and ’round until I had for force quit and shut down*. Distraught — remember my beautiful data columns from the last post?! — I gave myself some time away from the project to collect my thoughts, and realized that in my haste to visualize some data! I had forgotten the basics.

Instead of re-inventing the wheel by creating separate gephi import files for nodes and edges I went to Table2Net and treated the data set as related citations, as I aimed to create a network after all. To make sure this would work I created a test file of partial data using only the entries for Joseph Beuys and Claes Oldenberg. I set the uploaded file to have 2 nodes: one for ‘artist’, the other for ‘yearMade’. The Table2Map file was then imported into gephi.

Screen Shot 2014-11-12 at 9.28.37 PM

Image 2: the first viz, using a partial data set file; a test.

I tinkered with the settings in gephi a bit — altering the weight of the edges/nodes and the color. I set the visualization as Fruchterman-Reingold and voila!, image 2:

With renewed confidence I tried the “BIG” data set again. Table2Net took a little bit longer to export this time. But eventually it worked and I went through the same workflow from the Beuys/Oldenberg set. In the end, I got image 3 below (which looks absolutely crazy):

Screen Shot 2014-11-12 at 9.34.07 PM

Image 3: OOPS, too much data, but I’m not giving up.


To image 3’s credit, watching the actual PDF load is amazing: it slowly opens (at least on my computer) and layers each part of the network, which eventually end up beneath the mass amounts of labels — artist name AND year — that make up the furry looking square blob pictured here. You can see the network layering process yourself by going to the figshare file set and downloading this file.

I then knew two things: little data and “BIG” data need to be treated differently. There were approximately 69,000 rows in the “BIG” data set, and only about 600 rows in the little data set. Remember, I weighted the nodes/edges for Image 2 so that thicker lines represent more connections, hence there not being 600 connecting lines shown.

Removing labels definitely had to happen next to make the visualization legible, but I wanted to make sure that the data was still representative of its source. To accomplish this, I used the map display ForceAtlas and ran it for about 30 seconds. As time passed, the map became more and more similar to my original small data set visualization — with central zones and connectors. Though this final image varies from the original visualization (image 2), the result (image 1) is more legible about itself.

Screen Shot 2014-11-12 at 9.52.56 PM

Image 4: Running ForceAtlas on what was originally image 3.

My major take-away: it’s super easy to misrepresent data, and documentation is important — to ensure that you can replicate yourself, that others can replicate you, and to ensure that the process isn’t just steps to accomplish a task. The result should be a bonus to the material you’re working with and informative to your audience.

I’m not quite sure what I’m saying yet about the Tate Modern. I’ll get there. Until then, take a look at where I started (if you haven’t already).

*I really need a new computer.

Mona Lisa Selfie: data viz part 1

Image from http://zone.tmz.com/, used with permission for noncommercial re-use (thanks Google search filters)

It took me a long time to get here, but I’ve found a data set that I feel comfortable manipulating, and it has given me an idea that I’m not entirely comfortable with executing, but am enjoying thinking about & exploring.

But before I get to that: my data set. I explored for a long time and, if you’ve read my comments, ran into a lot of trouble with RDF files. All the “cool” data I wanted to used was in RDF, and it turns out RDF is my monopoly road block: do not pass go, do not collect $200. So I kept looking, and eventually found a giant CSV file on Github of the artworks at the Tate Modern, along with another more manageable file of the artist data (name, birth date, death date). But let’s make my computer fan spin and look at that artwork file!

It has 69,202 rows and columns that go to “T” (or, 20 columns).
Using ctrl C, ctrl V, and text-to-columns, I was able to browse the data in Excel.

Screen Shot 2014-11-02 at 10.28.02 AM

seemingly jumbled CSV data, imported into Excel

Screen Shot 2014-11-02 at 10.28.14 AM

text to columns is my favorite

Screen Shot 2014-11-02 at 10.28.23 AM

manageable, labelled columns!


I spent a lot of time just browsing the data, as one might browse a museum (see what I did there?). I became intrigued by it in the first place because in my first trip to London this past July, I didn’t actually go to the Tate Modern. My travel companions had already been, and we opted for a pint at The Black Friar instead. I’m looking at data blind, and even though I am familiar with the artists and can preview the included URLs, I haven’t experienced the place or its artwork on my own. Only the data. As such, I wanted to make sure that any subsequent visualization was as accurately representative as I could manage. I started writing down connections that could possibly interest me, or that would be beneficial as a visualization, such as:

  • mapping accession method — purchased, “bequeathed”, or “presented” — against medium and/or artist
  • evaluating trends in art by looking at medium and year made compared to year acquired
  • a number of people have looked at the gender make-up of the artists, so skip that for now
  • volume of works per artist, and volume of works per medium and size

But then I started thinking about altmetrics, again — using social media to track new forms of use & citation in (academic) conversations.

Backtrack: Last week I took a jaunt to the Metropolitan Museum of Art and did a tourist a favor by taking a picture of her and her friend next to a very large photograph. We were promptly yelled at. Such a sight is common in modern-day museums, most notably of late with Beyonce and Jay Z.
What if there was a way to use art data to connect in-person museum visitors to a portable 1) image of the work and 2) information about the work? Unfortunately, the only way I can think to make this happen would be via QR code, which I hate (for no good reason). But then, do visitors really want to have a link or a saved image? The point behind visiting a museum is the experience, and this idea seems too far removed.
What if there was a way to falsify a selfie — to get the in-person experience without being yelled at by men in maroon coats? This would likely take the form of an app, and again, QR codes might need to play a role — as well as a lot of development that I don’t feel quite up for. The visitor is now interacting with the art, and the institution could then collect “used data” to track artwork popularity which could inform future acquisitions or programs.

Though this it’s a bit tangential from the data visualization project, this is my slightly uncomfortable idea developed in the process. I’d love thoughts or feedback or someone to tell me to pump the proverbial breaks. I’ll be back in a day or so with something about the visualizations I’ve dreamed up in the bullets above. My home computer really can’t handle Gephi right now.


the interventionists

“To the rescue, many librarians believe computers are the only means to effectively cope with their bulging bookshelves”. 1966. New York World-Telegram and the Sun Newspaper Photograph Collection (Library of Congress).

I must admit that I am still belaboring the idea of the field of DH as a (partial) means to subvert the strong focus on research and publishing for tenure to instead promote and enhance teaching & learning. Not to throw CUNY & the Academic Commons under the proverbial bus — it’s great, really! And I find it beneficial on many levels, academically and professionally — but the AC as a collaborative place limited to faculty, staff, and doctoral students is perhaps just redefining self-inclusive nature of academia*. The AC is also still imbedded within an institution where tenure is a reality. Sink or swim. Publish or perish (or my personal favorite, “It does not have to be good, it just has to be published,” which has said to me at least once at CUNY).

With all that said, having a centralized, digital place to provide such support and education to peers/faculty is, or could be, extremely progressive. In Digital Humanities Pedagogy Simon Mahony and Elena Pierazzo write, “what is needed is the development of a group space that exists somewhere between study and social areas” (217). The AC could directly answer to the need for such a group space should it eventually allow for a structure to accommodate it.

Within this process is the need to include the teaching parties by fostering their interest in engaging in digital technology into the classroom. Let’s be honest, part of the problem with academia/tenure is not just publishing fees, the subsequent pay-walls, and the cost of journals to libraries, but it’s also JOB COMPLACENCY. In some ways as students of DH we are being trained as the next generation of instructors who can then be on the front lines to promote and support continued efforts to get research, publishing, and tenure out of the ground and into the cloud(s). In Debates in the Digital Humanities Luke Waltzer writes, “More so than just about any other sub-field, the digital humanities possess the capability to invigorate humanities instruction in higher education and to reassert how the humanities can help us understand and shape the world around us.” DH doesn’t need to stop at humanities. It’s important to have that emphasis there, for the “learning for the sake of learning” and “lifelong learning” aspects of a humanities-driven education may become idioms of the recent past when still yet other disciplines can benefit from the tools DHers employ. For instance, teaching with DH concepts could become a gateway to future STEM interests and Open Access awareness. DH as a gateway drug, perhaps?

I almost wish DH had been instead titled “Interventionists”**. Academia needs a lot of creative intervention before true change can take place. Beginning the process in instruction is an excellent place to start as long as the institution supports the mission completely. That is to say, the process of instruction isn’t as wrapped up in the bottom line as publishing for tenure, and perhaps the trickle down effect of emphasizing digital technologies within traditional analysis can bring change overall.

*I believe this situation was mentioned in one of our first classes, and with good reason for the current design. If the AC is going toward the greater goal of community based digital collaboration, then I would argue that the place would need to evolve away from social media (i.e.: profiles and resumes, friendships, meeting announcements) to a platform that is used in undergraduate coursework and within workshops. A repository to instruct on new technologies and collaborate for pedagogical purposes. I imagine it being used as we are I’m DH praxis, but more widely (even within the GC).

**While the name “The Interventionists” is already taken, the concepts remain in tact to appropriate it for DH here: creative disruption.

REFERENCES

Gold, Matthew K., ed. Debates in the digital humanities. U of Minnesota Press, 2012.
Hirsch, Brett D., ed. Digital Humanities Pedagogy: Practices, Principles and Politics. Vol. 3. Open Book Publishers, 2012.

This week’s Twitter success, and how it affects (academic) conversation

Note to future twitter readers: start from the bottom & work your way up.

I’m having a really good week on Twitter (and not just because I have 30 or so new, wonderful followers from our DH praxis class, though that certainly helps).

Look at that: FIVE favorites, ONE re-tweet, and the re-tweet came from an Open Access related association/company/group that I don’t even know! Of course I followed them back.

The problem with Twitter, and specifically the tweets shown above, is that they’re difficult to document (or read) after the fact. These two in particular happened in succession as part of a conversation between me, myself, and the Wall Street Journal. They will live forever on the Internet, backwards. As a person that prides herself on subtle jokes and one-liners I find this deeply troubling.

  • Should I have tweeted backwards for the benefit of future readers, but to the disservice of active twitter users?
  • Should I delete?
  • What if some high ranking administrator at my institution sees my Tweet and doesn’t get it?
  • Should I make my Twitter private? What’s really the point of Twitter, then?
  • Should I have hyperlinked the article in question? What if it had been behind a pay-wall?

(When my worries about Twitter use turn into a bulleted list, I know it’s time to slowly back away from the computer…)

The Library of Congress has begun archiving tweets, so I am inclined to believe that the present conversation is not what matters but rather the conversation’s future impact. Despite my better-than-average week on twitter – combining popular media with my profession in a concise-less-than-140-character package – I’m not sure if who actually matters actually cares.

Academia is beginning to care. I think. Emerging products such as Altmetric (and specifically I’m talking about Altmetric the product from Digital Science, not altmetrics the concept) enables researchers and scholars to quickly see the active conversations happening around article-level content. Such information happens in real-time, just as twitter intended. This function is contrary to both the current rate of publishing – super, super slow – and well curated article citations that have historically defined academic conversations. The traditional academic conversation has seen criticism of late, with the emergence of peer review scams and bogus scientific articles, which to me indicates a serious flaw in the publishing process, available resources, and the resulting competitive nature of academia. Despite the emergence of such concepts and products that may very well be helping to subvert the traditional process I am brought back to Matthew G. Kirschenbaum’s reference in regards to academia and the Silicon Valley. With my altmetrics/Altmetrics example, the concept emerged as a possible solution to collect and display scholarly conversations, but the product (capital “A”) has been monetized.

In my daily work – I’m the E-Resources Librarian at Queens College – I receive cold-calls (industry term: “Inside sales”) on a schedule: at the end of each quarter, so that representatives can make their numbers and receive bonuses (for speed boats, etc.). Library vendors (publishers, mostly) want to sell me stuff, and yes, I’m very disillusioned about it. Before joining the ranks of faculty librarianship I worked for a vendor and I know well what’s happening behind-the-scenes before I’m called.

So how does this relate to DH? I’m not convinced that citing social media and related sources are DH. I do think that DHers, or those inclined to accept it as a discipline and perhaps learn and use its methods, are more likely to follow along via such outlets. I’m also curious about the monetary aspects of DH. When I join the ranks of those that can claim DH scholarship and practice, will I have to add names to my digital rolodex of “reps to dodge lest they try to sell me something”?