Preface: the files related to my data visualization exploration can be located on my figshare project page: Digital Humanities Praxis 2014: Data Visualization Fileset.
In the beginning, I thought I had broken the Internet. My original file (of all the artists at the Tate Modern) in Gephi did nothing… my computer fan just spun ’round and ’round until I had for force quit and shut down*. Distraught — remember my beautiful data columns from the last post?! — I gave myself some time away from the project to collect my thoughts, and realized that in my haste to visualize some data! I had forgotten the basics.
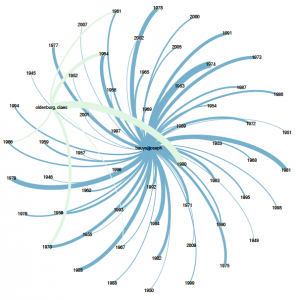
Instead of re-inventing the wheel by creating separate gephi import files for nodes and edges I went to Table2Net and treated the data set as related citations, as I aimed to create a network after all. To make sure this would work I created a test file of partial data using only the entries for Joseph Beuys and Claes Oldenberg. I set the uploaded file to have 2 nodes: one for ‘artist’, the other for ‘yearMade’. The Table2Map file was then imported into gephi.
I tinkered with the settings in gephi a bit — altering the weight of the edges/nodes and the color. I set the visualization as Fruchterman-Reingold and voila!, image 2:
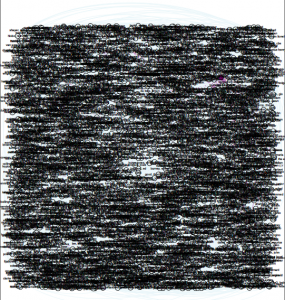
With renewed confidence I tried the “BIG” data set again. Table2Net took a little bit longer to export this time. But eventually it worked and I went through the same workflow from the Beuys/Oldenberg set. In the end, I got image 3 below (which looks absolutely crazy):
To image 3’s credit, watching the actual PDF load is amazing: it slowly opens (at least on my computer) and layers each part of the network, which eventually end up beneath the mass amounts of labels — artist name AND year — that make up the furry looking square blob pictured here. You can see the network layering process yourself by going to the figshare file set and downloading this file.
I then knew two things: little data and “BIG” data need to be treated differently. There were approximately 69,000 rows in the “BIG” data set, and only about 600 rows in the little data set. Remember, I weighted the nodes/edges for Image 2 so that thicker lines represent more connections, hence there not being 600 connecting lines shown.
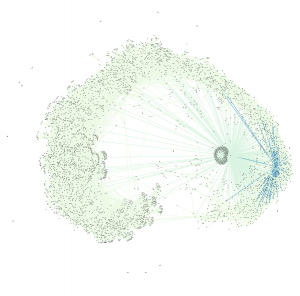
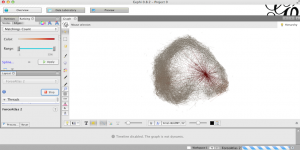
Removing labels definitely had to happen next to make the visualization legible, but I wanted to make sure that the data was still representative of its source. To accomplish this, I used the map display ForceAtlas and ran it for about 30 seconds. As time passed, the map became more and more similar to my original small data set visualization — with central zones and connectors. Though this final image varies from the original visualization (image 2), the result (image 1) is more legible about itself.
My major take-away: it’s super easy to misrepresent data, and documentation is important — to ensure that you can replicate yourself, that others can replicate you, and to ensure that the process isn’t just steps to accomplish a task. The result should be a bonus to the material you’re working with and informative to your audience.
I’m not quite sure what I’m saying yet about the Tate Modern. I’ll get there. Until then, take a look at where I started (if you haven’t already).
*I really need a new computer.


Kelly,
I’m super-impressed with your careful documentation. Understanding the obstacles you face is really useful. (I would totally offer a new computer if I could). Thank you for notating all the different programs you used along the way to get your data in a manageable form.
I guess it’s just a bonus that it’s about the Tate Modern (which is so neat — I could sit with the Gerhard Richters for hours).
-Jojo
Kelly,
Your data vis looks great!! I am thinking about using Gephi for my data set as well, so we should chat. Thanks for writing so much about your process!
Kelly this rulz.
These crazy 3d graphs are supper hard to get a handle on, turns out cuz the the stats they are based on are craz-y Prof Manovich introduced PCA: http://en.wikipedia.org/wiki/Principal_component_analysis
Principal component analysis even though it sound crazy made me feel a bit better about looking at some of these 3D maps.
Wow. And, cool!
Outrageously enthusiastic applause for this:
“My major take-away: it’s super easy to misrepresent data, and documentation is important — to ensure that you can replicate yourself, that others can replicate you, and to ensure that the process isn’t just steps to accomplish a task. The result should be a bonus to the material you’re working with and informative to your audience.”
I so appreciate how carefully you’ve thought out both the “how” and “why” of this project. Through your posts, you’ve sort of posited an ethics of data visualization, which I absolutely love.