Publishing Case:
Chris is a Data Analyst for the Advertising department of XYZ Publishing. He has the banner ads from this year’s holiday campaign. He is interested in analyzing what generated the highest click-through rates for the company. Chris has previously downloaded and installed TANDEM to his desktop tool. Chris drag-and-drops his folder of ads onto the TANDEM interface. A progress bar appears. A .csv file is generated in the backend to store the output. The completion page gives Chris a downloadable CSV. Chris is directed to brief guides on how the data could possibly be used/visualized. Chris goes the basic route and enters excel to explore his data. He compares the data to the clickthrough rates in the ad server and notices a trend in the relationship between brightness and saturation, along with the number of words on the advertisement, and how many users clicked the ad. The brightest ads with 10 words or less had the highest click through rates. Chris is able to make an data-driven argument with the design team for brighter ads with minimal text in future campaigns.
Scholar Case:
Professor Plum is studying how advertising strategies have been affected by a significant historical event such as World War I. He has collected a corpus of print advertising materials spanning multiple product categories both before and after the event which is being studied. Plum wants to know what has changed and has developed theories regarding a number of features among which are the following questions:
- Has the proportion of text to image changed? How?
- Has the word usage changed? How?
- Has the iconography changed? How?
- How has the visual style changed? Are the different colors being used? Are the images more contrasty?
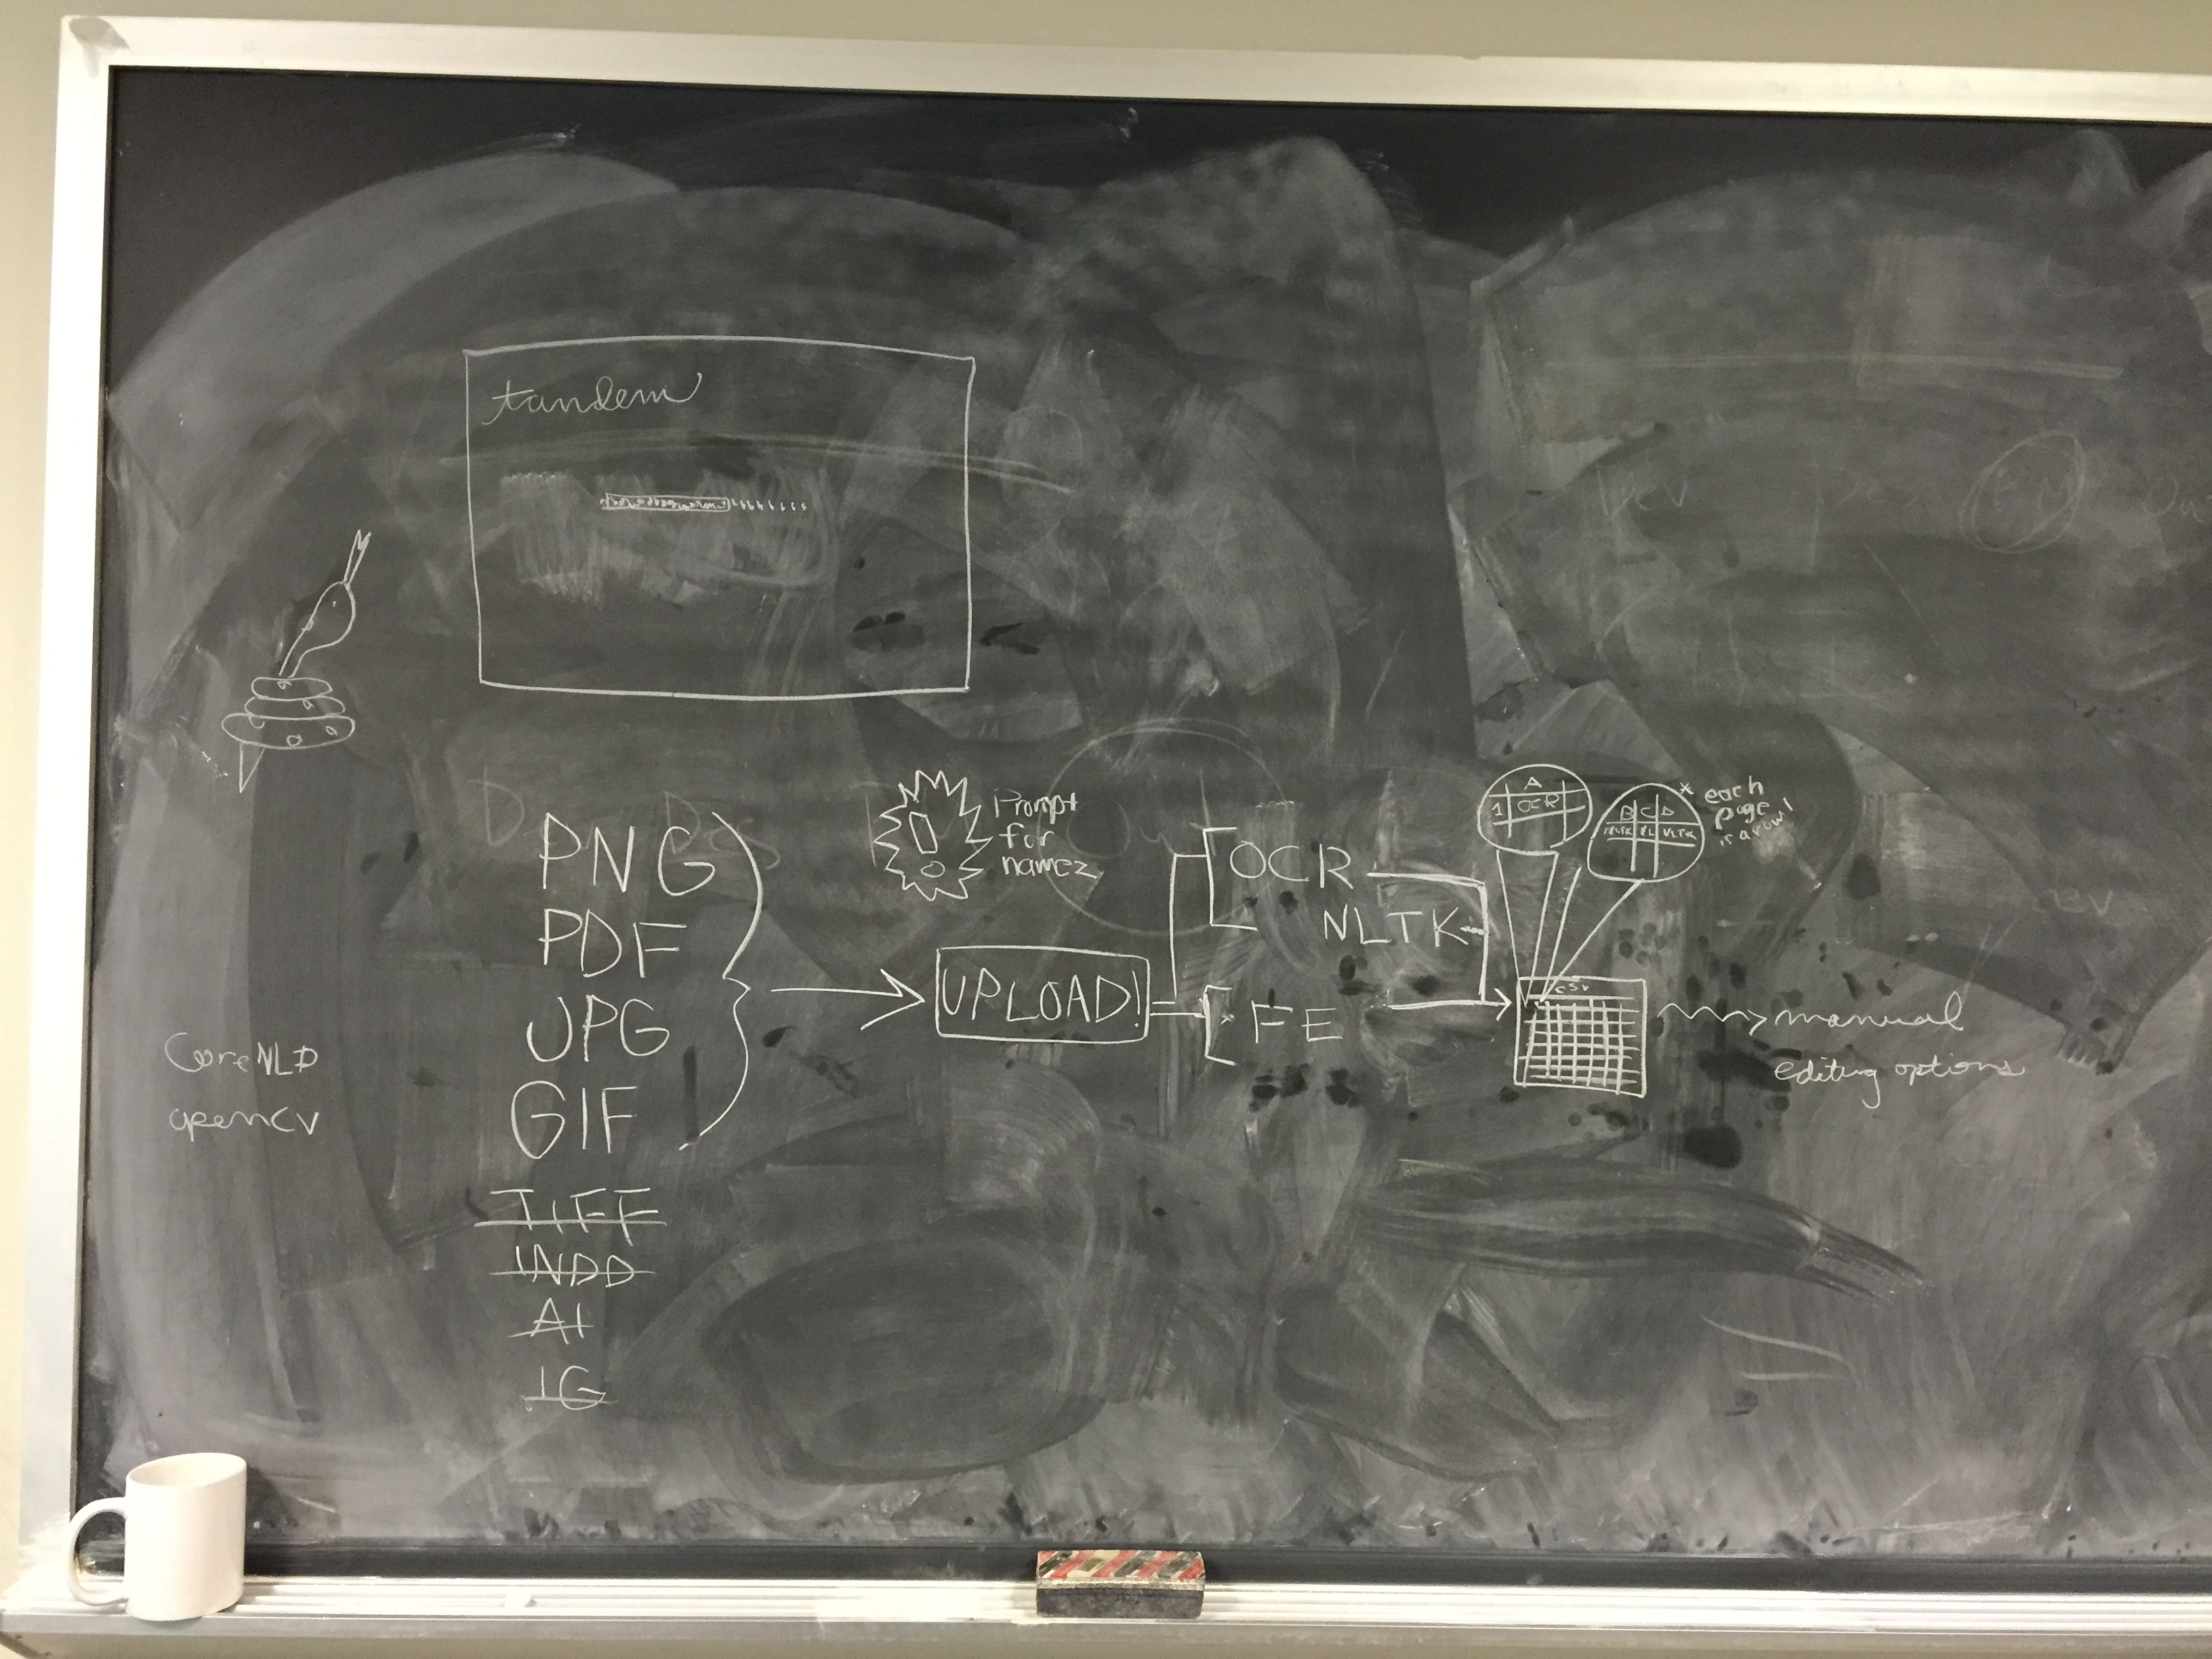
Using a tool outside of TANDEM, Professor Plum scans the materials into a digital format such JPG, TIFF, PDF or GIF. After the image files have been built, he downloads a copy of TANDEM from the Internet and installs it on his desktop computer. Plum launches TANDEM and starts the analysis process by inputting the name of the folder that contains the electronic documents being studies. TANDEM outputs OCR, NLTK and FeatureExtractor data into a database, which can be saved.
Professor Plum can now use TANDEM (or some other visualization tool) to produce visualizations or tables on the parameters that are of particular interest to the scholar. Based on the results of these visualizations, Plum may make some adjustments to the settings in TANDEM to produce a more useful result. He may choose to export the results database to another application for further work or study.
Educator Case:
An early childhood educator, Yasya Berezovskiy, wants to study the effects of children’s literature on neurological development, exploring factors such as narrative, image representations, and lexiles (or word complexity/reading level) together. To date, Berezovskiy has worked with empirical evidence and collected fieldwork data.
Berezovskiy will be analyzing a number of children’s books with varying factors, ranging from author collections, time published, and theme.
Using TANDEM Berezovskiy can upload page images or entire works to process the work’s text in comparison to the visual information. Once complete, Berezovskiy can visualize the processed files in split screen, with the original image beside the visualized data. From there, Berezovskiy can choose to isolate individual elements to analyze, such as opacity, density, text to image ratio, text to color ratio, shape to text ratio, and more. Alternately, Berezovskiy can download the raw processed data to analyze using a separate visualization program.
The processed data will be complementary to other observational research being done by Berezovskiy’s colleagues. Without TANDEM, the evidence from the children’s books would have been only descriptive. Further, without TANDEM it would have taken Berezovskiy multiple programs and more effort.
Fairy Tale Nerd Case:
The user, a woman interested in creating a datavisualization for a pop lit site like Toast.net — let’s say Ella, wants to look at Victorian illustrated fairy tale collections. Ella wants to analyze captions for art plates in all available published works. She wants a computer to process all available picture books to give her more information on the content of a work based on its visual properties as well as its textual content. She wants to get a computer to pull all the words included in the illustrations, as well as the ratio of those words in relation to what is written in the story (Are they direct quotes? Are they distinct?). She goes to the TANDEM interface. There, she sees a simple description of what files the application will yield. It’s so understandable! All the fields are so well explained! She clicks the upload button, finds the files on her computer, uploads the picture book scans, and runs the application. Once the TANDEM program has run, another window appears offering a number of file types. Each file type has a scroll over description of its applications and recommended datavis links. Once she has selected, she can download the data file (CSV or …. …..).
Ella takes it to her favorite datavis site and goes wild with joy at the new capabilities and bases for comparison. All her dreams have been answered. Thanks, TANDEM!