Category Archives: Student Responses to Lectures & Workshops

Good Morning All,

This is my first blog post and I am sorry that I waited so long to do it.  In the past I have been a bit of a tech phobe.  I was inspired to take this course because I am one of those people that likes to challenge myself and learn new things.  I must say that up until this point I was trying to figure out how my social work background and now Phd Urban education lens fits in in the digital humanities world.  Yesterday’s NYPL lab visit, coupled with the Neatline workshop was when the light bulb finally went on for me in all of this.  I have been amazed by the readings, presentations and your visualization projects and kept thinking when the heck is this going to make sense for me.


o-KID-RIDING-BIKE-WITHOUT-TRAINING-WHEELS-570


Aha! I finally got it!

The oral history digital project naturally caught my attention as I have been professionally trained and  always innately intrigued by people’s life story and trajectories.  Immediately I thought about how I might pursue my digital humanities project proposal as I feel that the communities that are impacted the most by social-political inequities and injusticies are sometimes far removed from data and research theories.  To that end,  I am always thinking about ways in which all of this great data may be accessible and available to those of us who have a tech phobia or just don’t have the time or the jargonese to read through pages and pages of journal articles, blogs, newspaper articles and the like.  I may have found a way.  David McClure did an amazing job of explaining the software and its uses and walked us trough the process and I was so excited.  It felt like that first time you learn how to ride a bike; that moment when some pushes you from the back and lets go and then you suddenly realize that they have let go and that you are doing it on your own! Yes, that feeling.  I am on my way and  a work in progress.

Selena and I are working on a mapping project which I will share in a later blog but I wanted to share with you all that I have finally gotten how I might use digital humanities in my work as a social worker, an educator and researcher.  Thank you all for sharing of your journey and normalizing the challenges.  More to come soon!

NYPL Labs visit

Yesterday’s visit by NYPL Labs was inspiring. What we discussed today was mostly discussed before in the semester, but it was refreshing to hear it from non-academics, DH practitioners who carried a passionate and playful tone (though still obviously knowledgeable) that wasn’t over-analyzing/intellectualizing/rehearsed (that’s not to say that our previous guests were). Josh (?) was almost poetic in describing how they aimed to “breathe life into the collection” and save it from being “frozen in amber.”

As I mentioned in class, I’m proposing a project of digitizing an series of installations curated by the APA Institute at NYU. I’ve been tackling some methodological and theoretical issues that we luckily addressed, mostly on the original consumption of the archive, observer’s experience of serendipity, and how to address what is not represented.

  • What was the original intended consumption of the archived object and how do we translate it something that is native to digital? Johanna Drucker addressed this in her critique of eBooks, which “often mimics the most kitsch elements of book iconography” and in doing so we only stimulate “the way a book looks” (Drucker, 2008, 216-217) and not thinking about how it is used and how we can extend that type of thinking to the digital environment. The NYPL Labs had a creative take to this question with their 3D images site, http://stereo.nypl.org/.
  • How do we recreate the experience of accidental discovery/serendipity in the digital space? During Kathleen Fitzpatrick’s visit, she spoke about the technicality of this, by collecting metadata and tagging. In Planned Obsolescence, she delves a more into looking at the structure of the original material and the digital environment, going beyond the ink to pixel conversion. The NYPL Labs guys echoed the same notion about structure, that a serendipitous discovery is surprising but not random because the data belongs in a structure and it is transparent how you arrived at your discovery. But they also questioned if this recreation of serendipity is in the power of the creator.
  • Stating your limitations of your project. Like scientists, we should the boundaries of our experiments, noting what was specifically included and excluded so it is not assumed that the results reflect all data (whatever that means). In the world of google and wikipedia, we need to be mindful of the constant creation and revision of knowledge. Even with tools for data scraping, we still need to question what is being left out and why.

They shared some great links. Here are some that I noted in case you wanted to revisit:

Drucker, Johanna. 2008. “The Virtual Codex from Page Space to E-space.” In A Companion to Digital Literary Studies, ed. Susan Schreibman and Ray Siemens, 216-32. Oxford: Blackwell.

Joy Report – Data Tech [E]mmersion

It’s good to know your strengths.

I’m never going to be a data dude. Thanks to Stephen Real who turned me onto Lynda.com (forwarded from Matt), I watched several tutorials trying to recreate what Micki shared during her workshop on Thursday, Oct. 31st.

But, let me back up a moment. Since acknowledging that I’m probably never going to be a data-dude, it occurs to me that my particular strength is as a communicator. To that end, let me share the last two week’s adventures in tech. I have been to EVERY available workshop except the ones on Thursday evenings when I have a previously scheduled class.

This has amounted to six in-person workshops at GC, one FB page, one WordPress site, three online tutorials and an impulsive registration for a Feminist technology course at Barnard (thank you Kelly for referring the info).

Here is what the last month of data-tech-[E]mmersion have looked like:

  • Tuesday, September 30 – Digital Fellow’s Social Media & Academia: Creating Digital Research Communities Workshop, (Andrew G. MKinney & Laura Kane), Library GC
  • Friday, October 1 – I wrote a “Twitter” review for the workshop and shared it with my classmates in the DH Praxis 2014 blog site on the Commons.
  • I also tweaked the Mother Studies webpage on the Commons blog post-workshop
  • Friday, October 24 – Fellows consultation with Patrick Smyth who showed me Ngram, “Python for kids” workbook, and some other cool things like “Internet Time Machine”, and “Distance Machine.”
  • Saturday, October 26, blogged about my experience with Patrick, and Ngramed two of my other classes at GC to compare words and texts from a gender perspective; American Studies, and Sociology of Gender.
  • Art+Feminism Wiki Workshop GC

    Art+Feminism Wiki Workshop GC

    Monday, October 27 – Wiki Art + Feminism workshop GC – we learned some Wiki code and also found out that only 5% of Wiki contributors are women.

  • Tuesday, October 28 – WordPress Advanced level users, Library GC. This workshop really helped me see some of the advanced options available to edit my site on the commons. Although these workshops are also frustrating because often we aren’t actually able to try things in the class and its tough to remember everything once you get back to your desk. Workshops should have an additional help session, or follow up lab (or online resource attached to them)
  • Wednesday, October 29 – Data Mapping for social media, Library GC
  • Came home that night and built a FB page and blog site called “OurHealthStories.” Thought this might serve as a repository for the big data project and these notes from class. Too much for the DH Blog (Don’t wanna be a “Blog Hog”). I’ve combed through a lot of data sets at this point, and many of them are health related. My own health issues, the state of health care in America today, and recent stories like the one about the creator of the game “Operation” who can’t afford an operation really touched me, and made me want to take action.
  • Below is a list of the data sites I’ve investigated thus far. I was envisioning a project comparing midwife activity to OBGYN deliveries in America because there is a section of my thesis that would benefit from this. Wrote my advisor.

B-
I have to run a data project for my DH class.
Have you ever, or do you have data on this:
Compare midwife assisted birth to physician assisted birth in US, and data map it.
I want to see the measurable comparisons of how midwives practice relative to doctors. Please let me know if you have anything, also because I want to use it in my thesis paper.
_

She wrote back and advised against it:
“There is a TON of data on this, and it’s kinda complicated.  How are you defining midwife?  Nurse-Midwife in-hospital? all midwives?  all locations, birth centers, hospitals and homes?  How are you controlling for maternal status?  Just go take a quick look at the literature and you’ll see.  I would not encourage you to include this in the thesis — not in this kind of oversimplistic ‘docs’ vs ‘midwives’ way — as I say, WAY too complicated for that.”
__

I wrote a friend of mine who is a public health nurse at Hunter.
She wrote back:
“Here are some sources. Is it by state or national data you need to map? Do you know Google Scholar search? 
Here’s a link to a report published in 2012 re Midwifery Births 
Here’s a link to an article comparing births MD vesus CNM
National Vital Statistics Report  ***** best resource for raw data
CMS Hospital Compare
https://data.medicare.gov/data/hospital-compare
National Center for Health Statistics Vital Data
http://www.cdc.gov/nchs/data_access/Vitalstatsonline.htm
NYC Dept. of Health Data & Statistics http://www.nyc.gov/html/doh/html/data/data.shtml_”

  • Thursday, October 30 – Data Visualization, (Micki Kaufman), Library GC; Impressive project and great demo. Again, I wish we could have actually tried to do some of the things Micki demoed.
  • Friday, October 31 – Can’t attend the Fellows open hours this week or next week. Wrote Micki to see if she could meet with me at any point during next week for specific questions/answers? Began to export and clean a data set from last year’s academic MOM Conference, thinking it would be interesting to map the geographic locations attendees hailed from.
  • Saturday, November 1 – Began the day online taking tutorials. Stephen Real and I met before class on Thursday and he suggested a few things after we discussed how we could create a collaborative project. Today I’m watching Lynda.com videos, but for the tutorials that follow up on where Micki left off on excel documents, I work on a MAC and don’t have a left/right click mouse. So I can’t try a lot of the things they’re demoing. Going to try PDF conversion and scrapping now.
  • Thursday, Nov. 6 – Stephen Real and I met up. He and I “played” with some data cleaning stuff. He told me about his “Great Expectations” project. Sounds cool. Spoke with Chris Vitale generously shared some of his tech finds (which people have already been writing about here). Stayed late to talk research ideas with Stephen Brier.
  • Friday, Nov. 7 – Technology and Pedagogy Certificate Program at the Library. We talked wordpress, plug-ins, and sever technology.
  • Weekend, Nov. 8 – did some research on potential final projects. Explored DH in a Box. I have three ideas. Can’t decide which one to go with. Thinking about creating a survey monkey to ask classmates which idea they like best?

I signed up for “Technologies of Feminism” at Barnard. Starts November 18 and runs for 5 weeks. Here’s what it’s about. Feminism has always been interested in science and technology. Twitter feminists, transgender hormone therapy, and women in STEM are only more recent developments in the long entangled history of tech, science, and gender. And because feminism teaches that technology embodies societal values and that scientific knowledge is culturally situated, it is one of the best intellectual tools for disentangling that history. In this five-week course, we will revisit foundational texts in feminist science studies and contextualize current feminist issues. Hashtag activism and cyberfeminism, feminist coding language and feminized labor, and the eugenic past of reproductive medicine will be among our topics. Readings will include work by Donna Haraway, Maria Fernandez, Lisa Nakamura, Beatriz Preciado and more. Participants of all genders are welcome. No prior knowledge in feminist theory is required.

During the fall 2014 semester, courses similar to this one are taking place across North America in a feminist learning experiment called the Distributed Open Collaborative Course, organized by the international Feminist Technology Network (FemTechNet). As a node in this network, our class will open opportunities for collaboration in online feminist knowledge building—through organizing, content creation, Wikipedia editing, and other means. Together, we will discuss how these technologies might extend the knowledge created in our classroom to audiences and spaces beyond it.

Still haven’t pulled together a comprehensive plan amidst the massive choices available for the data project yet.

WHEW!

I’m en-JOY-ing the journey, but I’m not sure if I can pinpoint a location or product YET. Onward I suppose.

Journaling Data, Chapter 2

Statistics and R

I am pursuing two unrelated paths. The first of which is a collaborative path with Joy. She has identified some interesting birth statistics. The file we started with was a PDF downloaded from the CDC (I believe). I used a website called zamzar.com to convert the PDF to a text file. The text file was a pretty big mess, because it included a lot of text in addition to the tabular data that we are interested in.

Following techniques that Micki demonstrated in her Data Visualization Workshop, I used Text Wrangler to cut out a single table and gradually clean it up. I eliminated commas in numeric fields, and extra spaces. I inserted line feeds etc. until I had a pretty good tab-delimited text file, which imported very cleanly into Excel, where I did some additional cleaning and saved the table as a CSV file that would work well in R. The table reads into R very cleanly so that we can perform simple statistics on it such median, min and max.

 Text Analysis

My other data path is working with text, specifically, Dickens’ “Great Expectations”. I have used no fewer than three different tools to open some windows onto the book First a loaded a text file version of the book into Antconc, “…a freeware tool for carrying out corpus linguistics research and data-driven learning.” I was able to generate word counts and examine word clusters by frequency. The tool is very basic so until I had a more specific target to search, I set Antconc aside.

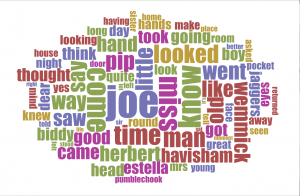
At Chris’s suggestion I turned to a website called Voyant-tools.org, which quickly creates a word cloud of your text/corpus. What it does nicely is provide the ability to apply a list of stop words, which eliminates many common frequently used words, such as ‘the’ and ‘to’. Using Voyant, I was able to very quickly create a word cloud and zero in on some interesting items.

Screenshot 2014-11-09 10.19.59

The most frequently mentioned character is Joe (in fact, Joe is the most frequent word) and not Pip or Miss Havisham. That discovery sent me back to Antconc to understand the contexts in which Joe appears . Other words that loom large in the word cloud and will require further investigation are ‘come’ & ‘went’ as pair, ‘hand’ and ‘hands’, ‘little’ and ‘looked’/looking’.

Lastly, I have run the text through the Mallet topic modeler and while don’t know what to make of it yet, the top ten topics proposed by Mallet make fascinating reading, don’t they?

  1. miss havisham found left day set bed making low love
  2. made wemmick head great night life light part day dark
  3. mr pip jaggers pocket mrs young heard wopsle coming question
  4. boy knew herbert dear moment side air began hair father
  5. time long face home felt give manner half replied person
  6. back thought house make ll pumblechook herbert thing told days
  7. joe don mind place table door returned chair hope black
  8. hand put estella eyes asked stood gentleman sir heart london
  9. good round hands room fire gave times turned money case
  10. man looked biddy sister brought held provis sat aged child

At this point the exploration needs to be fueled by some more pointed questions that need answering. That is what will drive the research. Up until now it has been the tools that have been leading the way as I discover what they can do and what buttons to push to make them do it.


Where do the ‘others’ fit in?

I’m writing this amidst a whirl of thoughts and tracks. Kathleen Fitzpatrick’s views on authorship and the status of private scholarship are impinging on my decision to write to a paper for the final assignment. On one hand, I am glad I read her while battling the dataset project, on the other, she is making me think where my final paper fits in the evolving landscape of scholarship. I am suddenly not satisfied to leave the paper to seclusion. And I am beginning to see the wisdom of having a blog and our instructors’ encouragement of documenting our ‘play’ with datasets. Even as blogs give ‘voice’, it also seems that the essential output remains writing, which, contrary to my decision to write a paper, I’m not entirely comfortable with. I’m still wondering why thoughts presented in writing alone qualify as scholarship; can’t a painting or music do the same? I know there are brave folk who’ve battled this, Nick Sousanis and his dissertation, written and drawn entirely in comic book format, comes to mind. But none of that is considered mainstream. It seems that  exchange and communication can expand when ‘intermedia’ becomes a reality, moving beyond the notion of ‘interdiscipline’? In the light of DH being a challenger of notions, how ‘other’ forms of expression can be included in scholarship is a thought to ponder.

For further reading on unusual dissertation forms, I invite you to browse through the following

http://www.hastac.org/blogs/cathy-davidson/2014/08/28/what-dissertation-new-models-methods-media

http://www.spinweaveandcut.blogspot.com/

Info Visualization Workshop

It was standing room only in Micki’s info viz workshop on Thursday. In order to make the demo more interesting, she used a dataset about the class attendees. We all entered our names, school, department & year in a shared online doc which became the basis for parts of the demo. We saw how to take text and clean it up for entry into Excel using a text edit tool, Text Wrangler. Tabs! Tabs are the answer. Data separated by tabs will go into individual cells in Excel, making it easier to manipulate once in there. Tabs>commas, apparently.

Once the data was in Excel, we saw some basic functions like using the data filter function, making a pivot table, an area graph and a stacked area graph.

After Excel we moved on to Gephi. Unfortunately none of the participants could get Gephi on our computers, so we just watched Micki do a demo. Using our class participant data, she showed us the steps to get the data in and how to do some basic things to get a good looking visualization, and how to play around with different algorithms and options. This was a pretty small dataset with few connections, so to illustrate some of the more complex things Gephi can do, Micki showed us examples from her own work. For me, this was the best part. I think Liam linked to it earlier, but I highly recommend you look at the force-directed graphs section on Quantifying Kissinger.

Stephen brought up the ‘so what?’ factor with regard to Lev Manovich’s visualizations. I thought Micki’s provided a good counterpoint to that, as she explained how certain visualizations made patterns or connections clear—things that might not have been revealed in another type of analysis.

Overall this was a very informative and useful workshop. It gave me courage to go home and play with my data in Gephi in ways that I didn’t feel able to before, and I hope it encouraged others to get started on their own projects.


Mapping Data: Workshop 3/3

Hi all,

Just to follow up on Mary Catherine’s post about finding data, I wanted to recap the final session of this workshop series that took place tonight.

The library guide on mapping data (by Margaret Smith) can be found here: http://libguides.gc.cuny.edu/mappingdata

As in the other two workshops, Smith emphasized thinking about who would be keeping this data and why as a part of the critical research process. It’s especially interesting given the size of these data sets and maps, meaning that the person (or corporate entity, NGO, or government agency) likely has a very specific reason for hosting this information.

She brought us through a few examples from basic mapping sites, like the NYT’s “Mapping America” which pulls on 2005-2009 Census Bureau data, to basic mapping applications like Social Explorer (the free edition has limited access, but the GC has bought full access) and the USGS and NASA mapping applications. The guide also includes a few more advanced mapping options, like ArcGIS, but the tool that seemed most useful to me, in the short-term anyway, is Google’s Fusion Tables, which allows you to merge data sets that have terms in common. The example Smith used was a data set of demographic data (her example was percentage of minority students) organized by town name (her example was towns in Connecticut) and a second set of data that defined geographic boundaries by the same set of towns. Fusion Tables then lets you map the demographic data and select various ways to visualize and customize your results.

My main takeaway from this series was that each of these tools is highly particular and unique, and you have to really dig into playing with the individual system before you’ll even know if it is the right tool for your work.

That, and also learn R.

Hyper Focus – What To Do When Everything and Everyone Are Important All The Time?

Is there an answer to “what to do when everything and everyone are important all the time?” Truth be told, the brain will do what the brain has been designed to– reduce the information into manageable segments. Some stuff will stick. Some won’t.

Laura Klein’s YouTube presentation posted on the CUNY commons for the DH Praxis class offered insight into the use of maps and graphs throughout history. Her demonstrations focused on the powerful influencing capabilities of data visualization.

I simultaneously skipped around watching Lev Manovich present live at MoMA in between pauses to Klein’s video last night. Manovich suggested that digital photography is the new art form now employed by billions of people. He described it as “new, young, and sexy.”

Meanwhile, I spent the past weekend at the 2nd annual conference for the New York Academy of Medicine. The NYAM festival was celebrating the 500th birthday of the anatomist Andreas Vesalius. Early anatomical drawings, it could be argued, were also maps of sorts, charting the human body as early as the 1500s. Dr. Brandy Schillace gave a talk titled “Naissance Macabre: Birth, Death, and Female Anatomy.”

The highlights of Dr. Schillace’s presentation were renderings focused on the pregnant form. The renderings of chaste females were often poised next to potted plants symbolizing the container quality of the pregnant woman. As Laura Klein suggested in her video, the symbolism indicated makes suggestions about how to best view the role of mother in Western culture. She is a vessel.

The afternoon at NYAM concluded with a presentation featuring ProofX 3D anatomical printing, which fashioned a heart valve over the next four hours. The demo-guy gave me his card. Armed with two lectures, several books, and some practical experience I suddenly felt empowered enough to log onto GitHub.

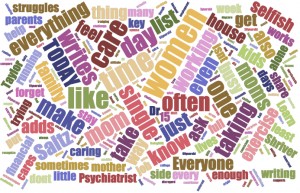
I plugged in a recent article on “Mothers Who Do It All.” Since I haven’t gotten into the programming end yet, I opted for the word cloud. Initially punching in 256 words from the article. I reduced them to 230 (so I could slightly control the visuals) and have uploaded the by-product here.

Word_Cloud_SmThe article cited wasn’t brilliant. It’s a rehash of the same old problem and doesn’t get to the point of possibly viewing women as intelligent procreative forces. Instead it’s a familiar subject from my days as an artist 20 years ago. How can women do it all, and make music too? (See MaMaPaLooZa). The word cloud isn’t particularly stunning either, but it represents a leap for in terms of the subject of “motherhood,” DH and how mapping might eventually lead me somewhere? (I couldn’t find anything of major consequence in my Google search).

Let me also conclude this blog by acknowledging that I recognize what a ‘soft’ subject motherhood is. To use Lev Manovich’s words, I’m not even sure it is very “sexy.” Even the word cloud looks “soft” evoking a “Hallmark Cards” visual. I know the subject doesn’t sound scientific or technical, and I’m not even sure what my angle is yet (although I have a few ideas). But as Laura Klein indicated in her presentation, while some cartographers, and data graph makers knew exactly what they were doing, others didn’t always have a clear concept at the onset.

If anyone finds any references to data, the digital humanities, and motherhood please send them my way. I’d be most interested. ~MJR

Living History

I read with avid interest Susan Hockey’s piece, “The History of Digital Humanities”. It turns out that this history closely parallels the arc of my life. By sheer coincidence, I was born in the year that Father Busa began work on his “index verborum” and I finished school about the time the concordance was first published in 1974. Like James Mason (https://dhpraxis14.commons.gc.cuny.edu/2014/08/29/digital-humanities-instilling-optimism-in-academia/) , I got my degree in English and could not do anything with it.

Finally, in 1978, I fell into a job as a mainframe computer operator. I had fun driving that big old machine, working with punch cards and huge reel-to-reel data tapes. My career led me to programming and then project management. Just as Hockey describes the advance of technology in the humanities, I lived through a similar evolution in the corporate IT world. The “invention” of word processing, the arrival of personal computers, the breakthrough of GUI (graphical user interface) and of course the history shaking impact of the Internet. I remember sending my first email. I remember working remotely on text-based terminal that operated over a telephone line at 300 bytes per second (it had no CRT; the I/O took place on spool of paper).

What is intriguing to me is that the tension between technologists and users of technology that seem to be taking place in the Digital Humanities is not a new phenomena. Techies have always been more interested in the tools than what can be done with them. I believe that Humanities has only lately been grappling with these issues because the technology is finally mature enough to deliver real value. It was much simpler to create systems that keep track of debits and credits, than to open up insights into the complex subjects that concern humanists. What seems to me to be unique to academia is the ongoing argument over the definition of Digital Humanities. Wouldn’t it be easier to simply do the work rather than agonize over what to label it?

Time will tell if this MALS program will lead me into a new way to study literature and theatre again or if it will open up a new arena for me leverage my technology career. Perhaps it will do both.