Dear Digitalists,
I have to say, this course is absolutely one the most fascinating courses I have ever taken (and I’m finishing my PhD—so I’ve probably taken the greatest number of courses here!). And I feel lucky to have met you all—you were such an inspiring group! Also a big round of applause to our two amazing professors—thank you for masterminding this seminar (a year ago I believe?); your pedagogical conceptions and curriculum designs are truly visionary.
Christmas is only a few days away, and I thought of posting something fun and Christmasy that is also related to my final project “Production of Desire, Consumption of Pleasure, and Creation of National Identity: Broadway Musicals as Cartography of US Sociocultural Values, 1920s-2010s.” In that spirit, why not run a data analysis of White Christmas, the Broadway musical adapted from a movie musical by Irving Berlin? It is by no means my favorite musical; in fact it is a pretty cheesy saccharine piece (with its own adorable moments). But so what? Christmas is all about eating candies and having some damn feel-good fun! So here we go:

What I’d like to see is which words stand out as topics/key words in this musical. Having been told that Mallet is best at handling topic modelling, I spent one afternoon teaching myself how to use Mallet.
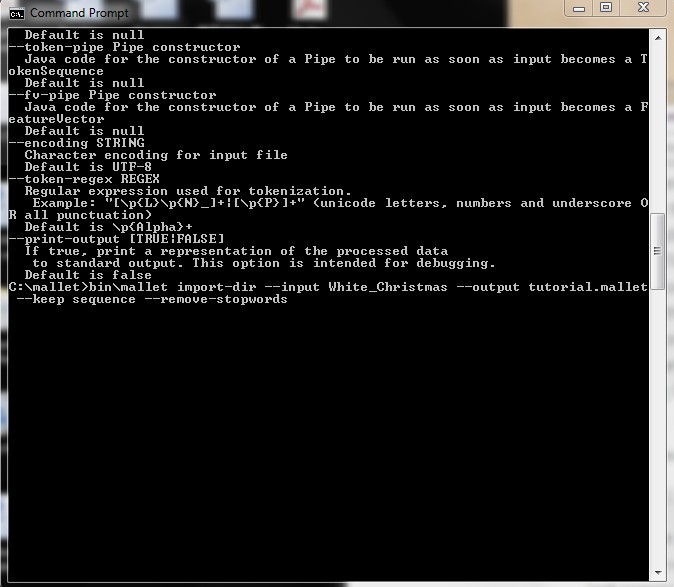
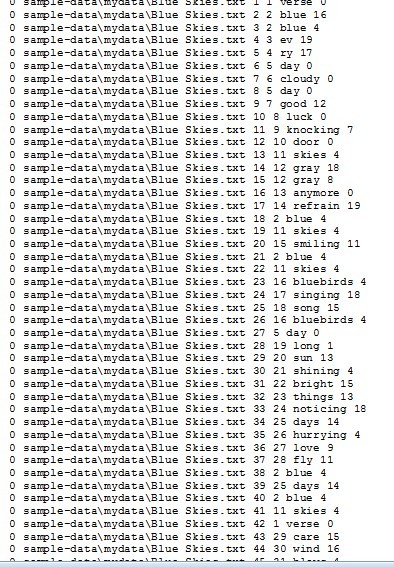
I start by installing both Mallet and Java developer’s kit. Then I pull the data (all the lyrics of the 18 songs in White Christmas) into one folder under Mallet, so it’s ready to be imported. I run Mallet using the Command Line and type in commands such as “bin\mallet import-dir –help” to test it. Then I import the data and command the Mallet to create a file called “tutorial.mallet.”
Then Mallet does its job and picks out the key words:
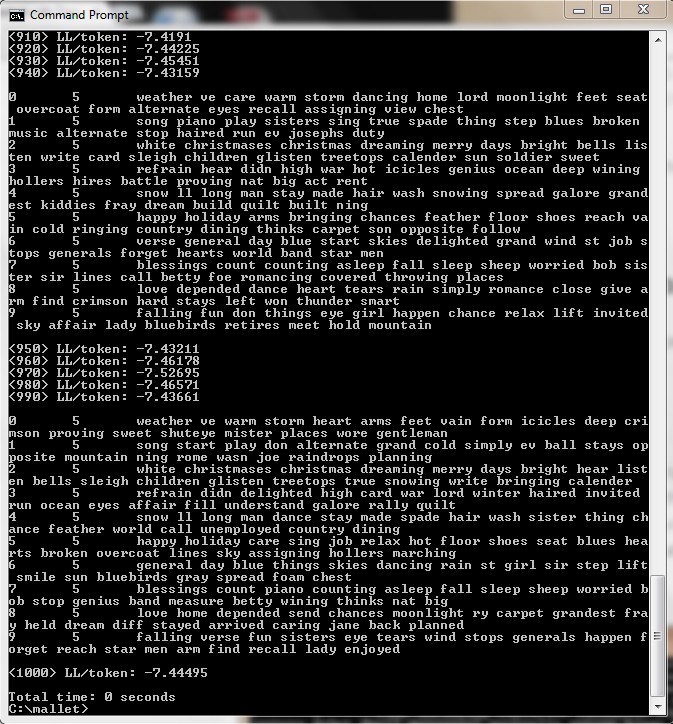
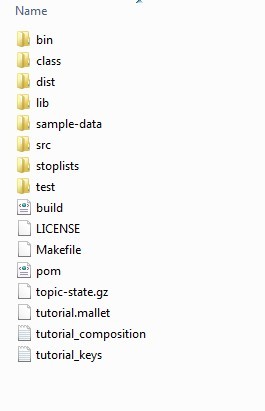
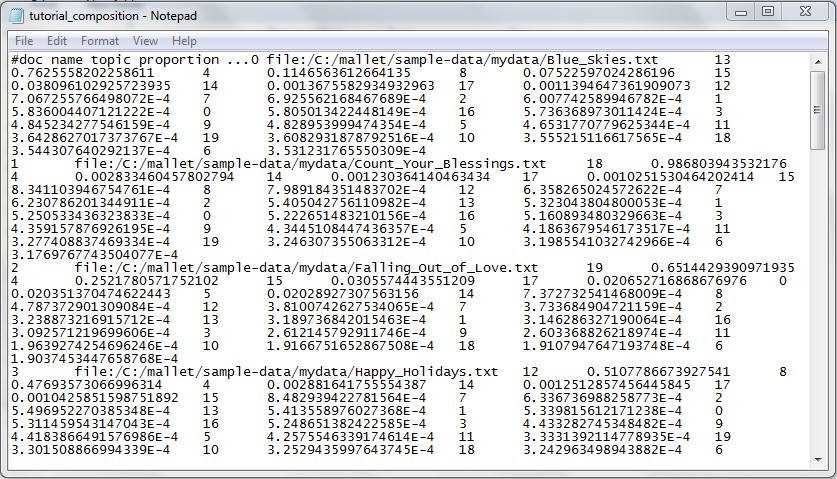
I make another command to open this file, and by typing in this command “bin\mallet train-topics –input tutorial.mallet –num-topics 20 –output-state topic-state.gz –output-topic-keys tutorial_keys.txt –output-doc-topics tutorial_compostion.txt” I ask the Mallet to find 20 topics, and it generates 3 documents:
1. Topic-state.gz
2. Tutorial composition
3. Tutorial keys
The first one is a compressed file that outputs every word in the corpus of my input and the topic it belongs to. And here is what it looks like after extraction:
The second one is the breakdown, by percentage, of each topic within each original text file.
The third file shows what the top key words are for each topic.
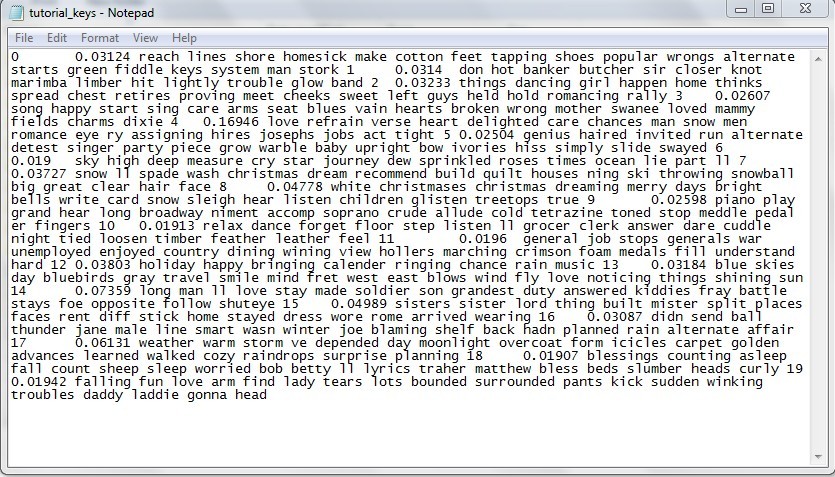
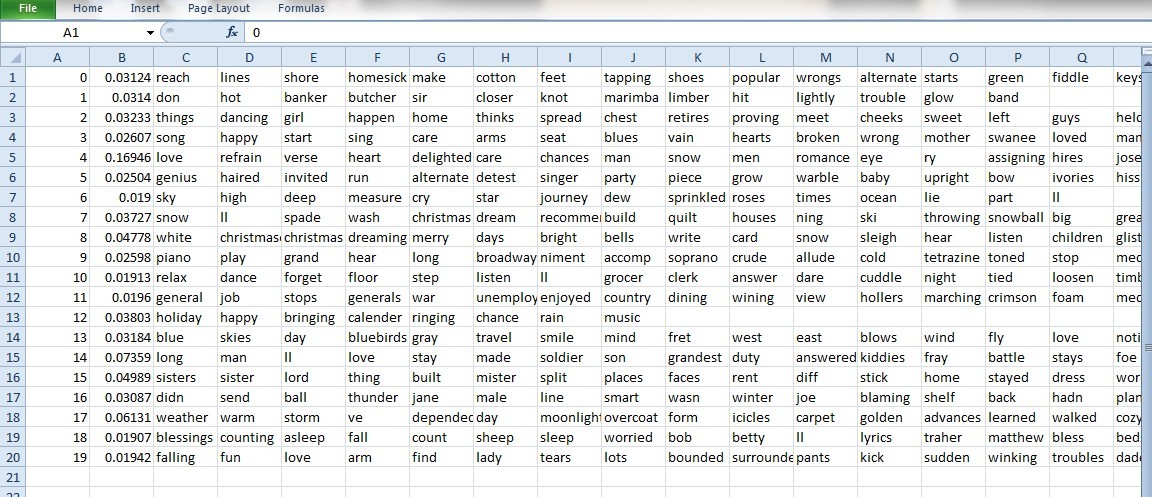
I clean up the data, and the result looks like this:


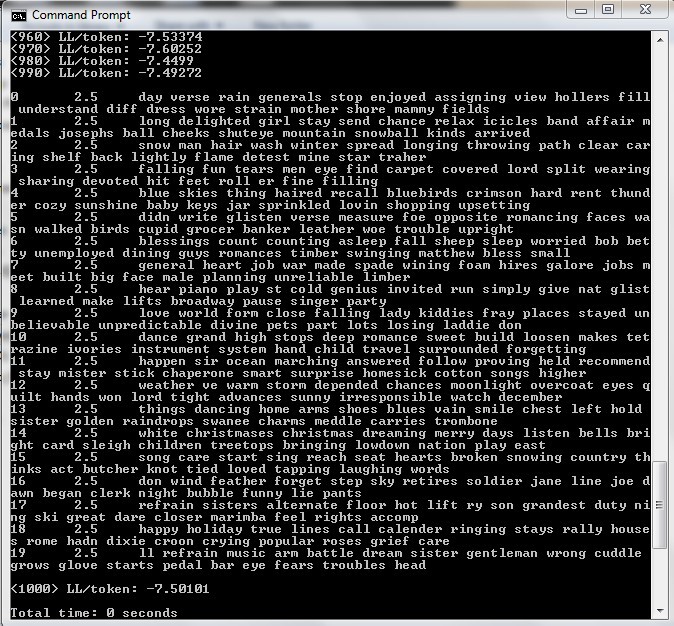
Now since Mallet is known for generating a slightly different result each time, I have to try it at least twice. In my second try, I use “optimize-interval” to lead to better results.
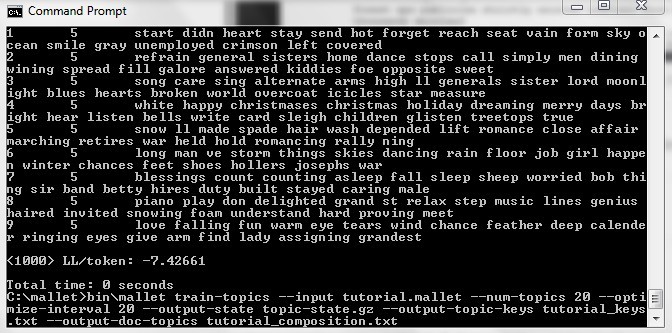
What this does is it indicates the weight of that topic! (Under item 8, “0.04778” is the “weight” of the topic “white,” followed by key words such as “bells” “card” “snow” and “sleigh.”)
This topic-modelling process sounds really simple, but it in fact takes quite some time to familiarize with. This is a try-out example of one musical; for a larger corpus of musicals, Mallet’s power should be more evident.
As for the musical data analysis of my project, I’m thinking of combining Schenkerian analysis with automating chord progression using idiomatic analysis. It is a musicological approach rather than audio signal processing. However, I’m not shutting down the latter option, since it might turn out to be more comprehensible to the general public—our eventual target audience. Also a shout-out, musicians in the group (I know there are several), come talk with me!
Merry Christmas everyone! (Looking at these key words makes my mouth covet sweetness; now where is my Twix?! …. nom nom…)
~Sissi