I found the projects on the Visual Complexity site really beautiful and interesting, and I was inspired to start playing with Gephi in anticipation of using it for my dataset project.
I’m happy I started early! I downloaded the most recent version of Gephi and went through the tutorial using the Les Miserables sample dataset with no problems. I figured since that was so easy, I’d go ahead and visualize my Facebook network, just for fun.
I used Netvizz to extract my FB data. I immediately ran into problems getting the data into a format Gephi could read. Netvizz says to ‘right click, save as’, which wasn’t actually an option. Ultimately I opened the .gdf data in the browser, cut and pasted into a an Excel file to save as a csv, and also pasted the same data into a text file and saved. The Excel csv data would load into Gephi, but the IDs and labels were all wonky, and the graph was clearly a mess with number strings as node labels. I then tried the text file, which threw up error an message and wouldn’t even open. Some amount of Googling & trial and error later, I discovered I had to change the format to UTF-8, and change the file extension from .txt to .gdf.
Once that was sorted, I had trouble displaying the data in ‘data laboratory’ view of Gephi. I eventually discovered that Macs (or maybe just my really old Mac) are not, for some reason, entirely compatible with the current version of Gephi. OK. Uninstall the current version, re-install an older version. Fortunately that solved that particular problem.
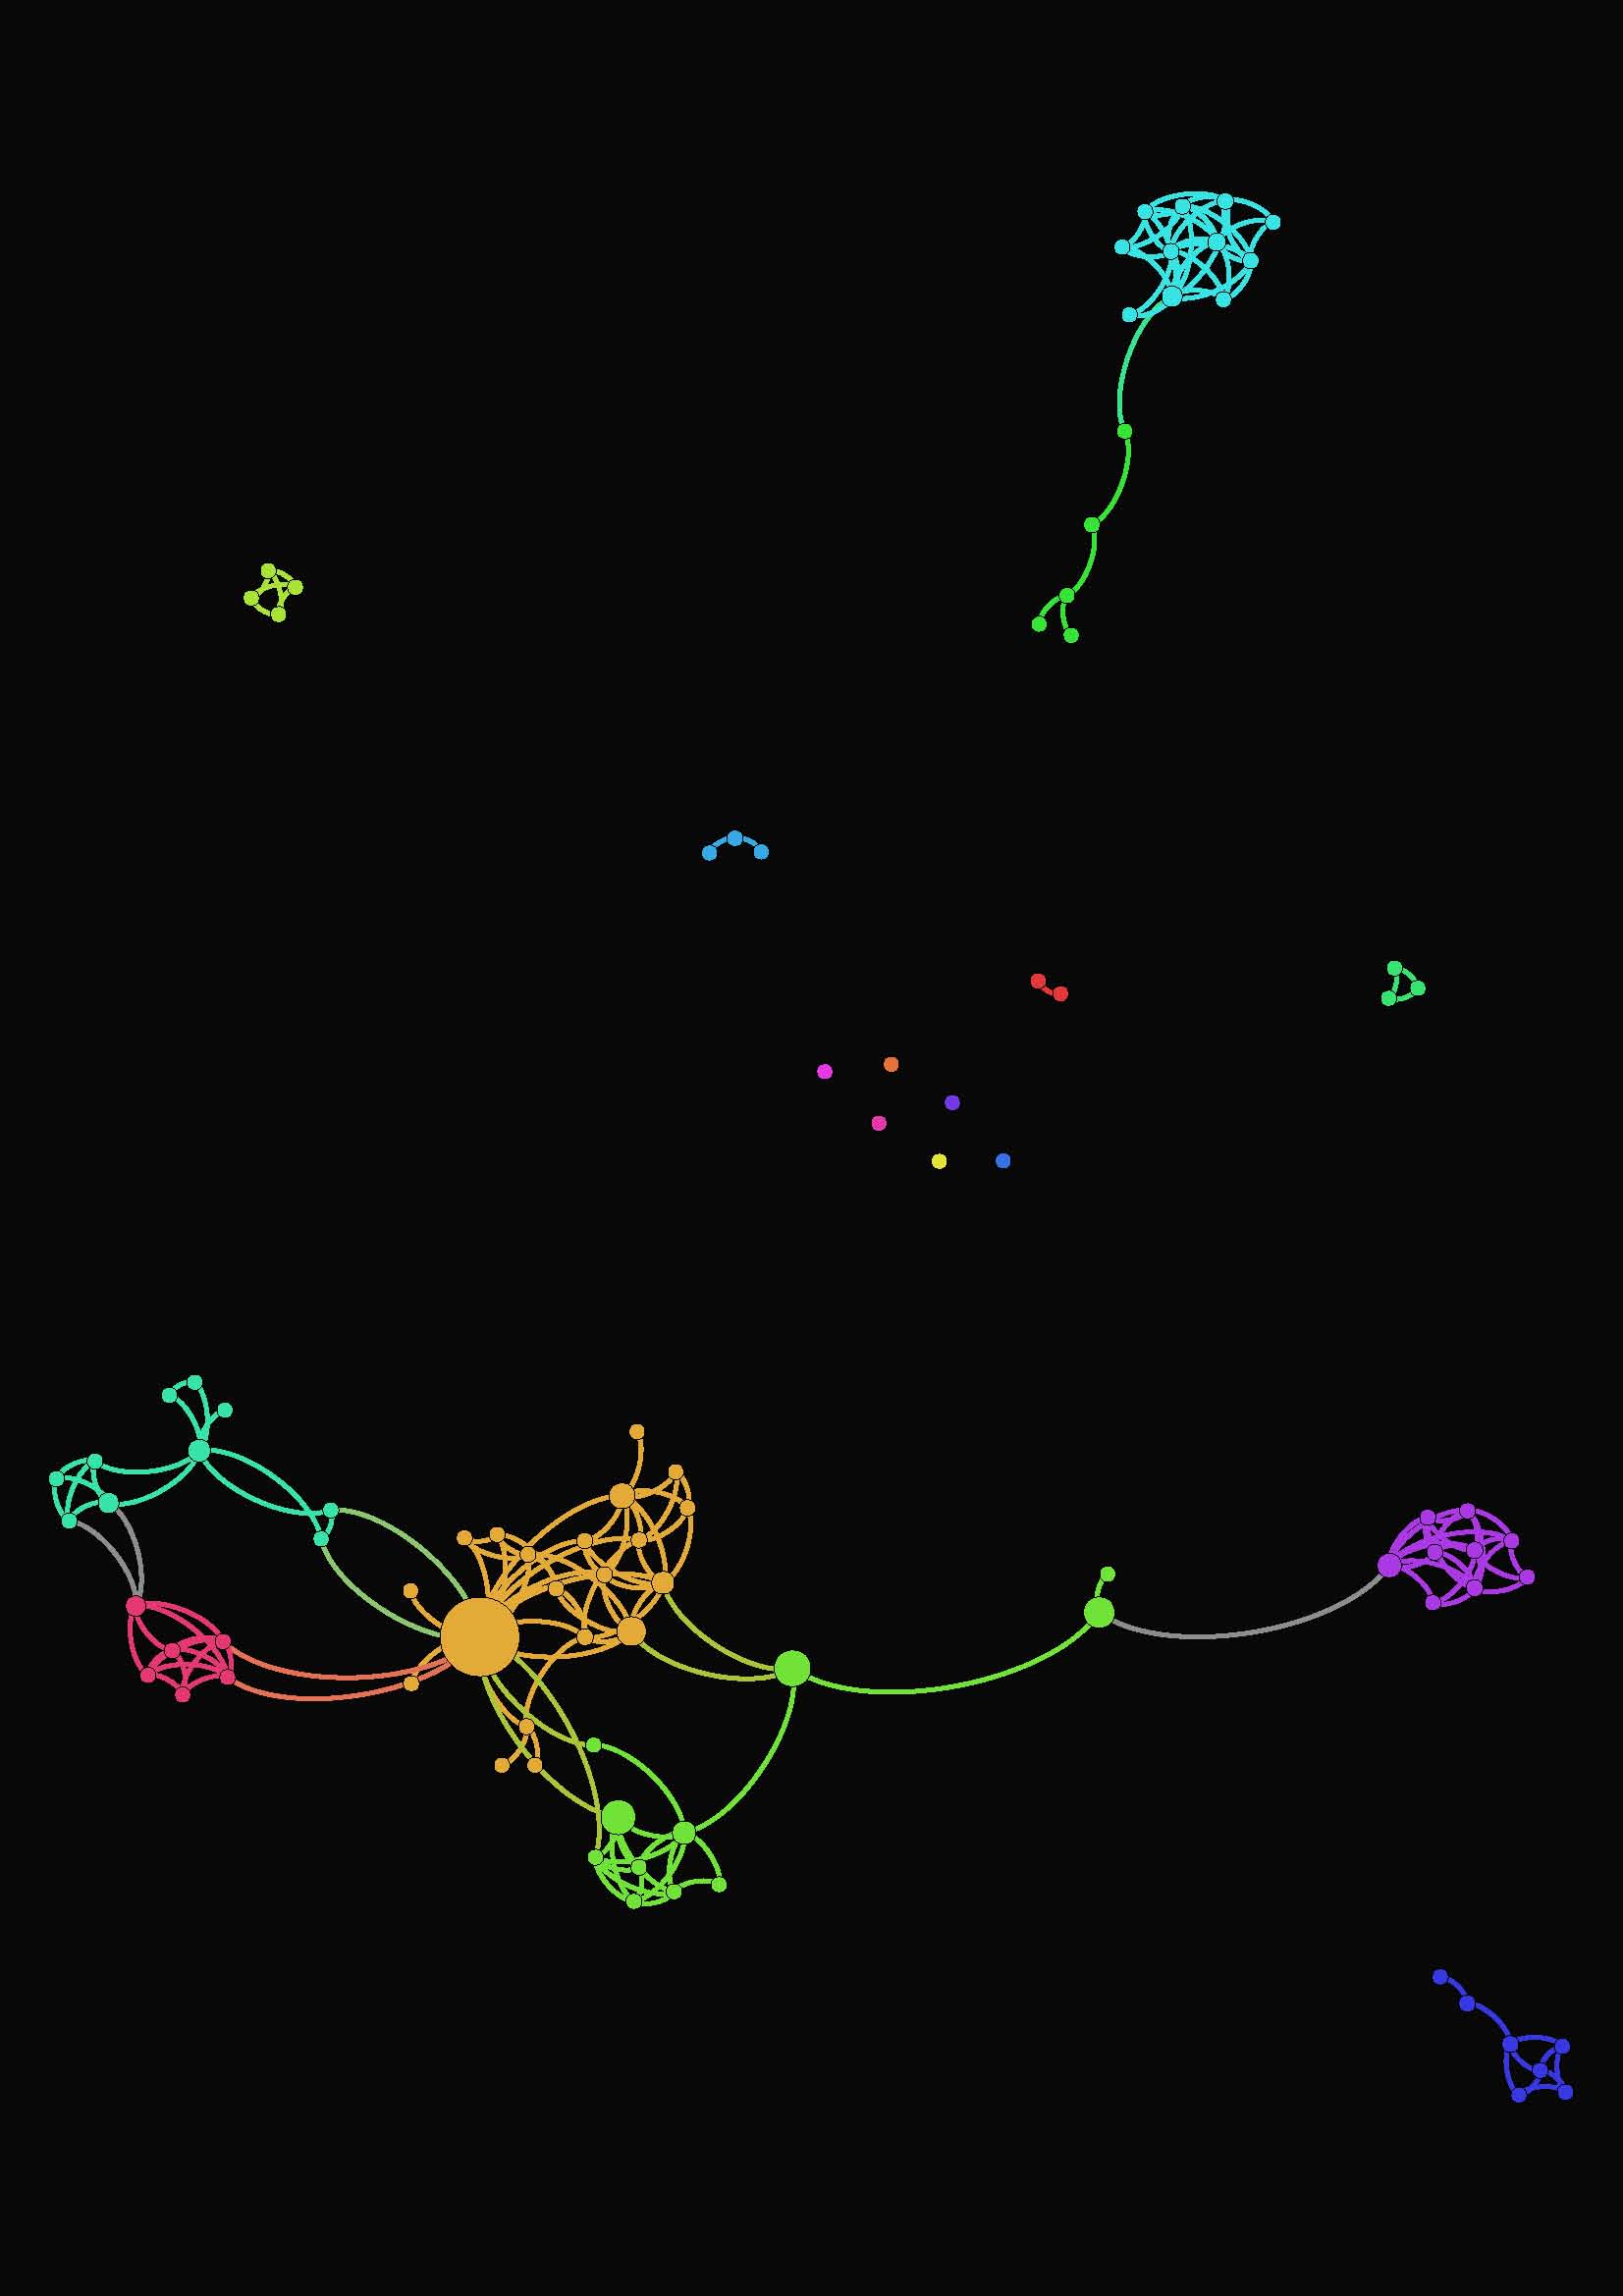
So! Eventually I was able to get the data to open properly, and the graph to start looking like it should. I used the same steps from the tutorial to create a graph of my FB network. This part was easy, as it had been with the sample dataset–just following the instructions for a really basic visualization. Beautiful.
Feeling emboldened by my problem solving and subsequent success, I started to play with a small part of my (anticipated) dataset. Several hours (and one trip to the grocery store) later, I’ve not been able to get the data into the proper format so that 1) Gephi will take it, and 2) it will display connections correctly. I can get one or the other, but not both.
This will definitely take more research & finessing, but I’m hopeful that I will be able to get it all to work. Stay tuned for the scintillating conclusion!