When I started on the Maps chapter of Moretti’s book, I immediately thought of my recent search for a literary map. I am a fan of Sara Paretsky’s series of V.I. Warshawski novels, which are hard-boiled detective fiction. There are 16 books (and two short stories) and they are rooted very strongly in Chicago. Throughout the series there are descriptions of not only the places V.I. goes, but also how she gets there—the route she drives, the trains she takes. Some of the places are fictional, but many are real.
As I was planning a recent trip to Chicago, I wanted to see a map of V.I.’s places overlaid on an actual map of Chicago. I did find one, although it only has 15 points on it, chosen seemingly at random from a handful of books. It was interesting, but not nearly as thorough as I wanted it to be.
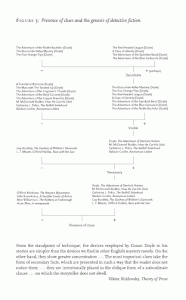
Unlike Moretti’s diagram maps, I was originally looking for a cartographic map. On p. 56, Moretti says he did not want to “superimpose” his diagrams on geographic maps because “geometry ‘signifies’ more than geography.” I started thinking about what my (imagined) V.I. Chicago map would look like as a diagram, and what it might show.
Paretsky deals explicitly with issues of class, race and gender in the series. V.I. grew up in a tough working class neighborhood and then ‘escaped’ the neighborhood by going to the private University of Chicago on scholarship. She is an abortion-rights activist, and many of her cases revolve around white collar crime. She often investigates on behalf of out of work factory and construction workers, undocumented immigrants, and prisoners. How (if at all) would these issues reveal themselves on a geometric map?
In his maps, Moretti sees the way industrialization and state formation have changed the shape of literary idylls (p.64). Would a geometric map or diagram of V.I.’s locations show or mirror Chicago’s change from a manufacturing city to a financial services city? What would the geometry of each book look like, and what would the geometry of the entire series taken as a whole look like?
ETA: The publication dates are between 1982-2013. V.I. (& presumably Chicago) age in ‘real time’, so the landscape of 1982 Chicago in the series is different from the 2013 landscape.
—
Thinking of literary maps where imagined and real places coexist got me to thinking about eversion and bus tours. Sex and the City location tours take you to actual locations the fictional characters visited—Magnolia Bakery, ABC Carpet & Home. A similar Girls tour is being planned, and there are plenty of others–Twilight tour anyone? The way in which people meld fiction and reality in their own lives isn’t specific to the internet/cyberspace realm.
—
In Macroanalysis, Matthew Jockers says that Library of Congress subject headings (LCSH) are a rich source of data to be mined. I agree! He is referring to the bibliographic metadata assigned to titles as a way to explore literary history (p. 35), but the subject headings on their own are also a source of data for librarians. Subject headings as data to be studied is near and dear to my heart—I wrote my library school thesis on LCSH and gender bias.
The LCSH scheme is the largest general indexing vocabulary in English, and has become the most widely used controlled vocabulary for subject cataloging in the United States. LCSH aims to be objective and use neutral language, but has been criticized for displaying bias on a wide variety of topics. There is a rich history of examining subject headings and their ostensible objectivity, starting with Sanford Berman in 1971. Hope Olson (who is one of my big research crushes) argues that LCSH “enunciates the authority of the dominant patriarchal, Euro-settler culture” (2000, p. 54).
At the time of my thesis (2011—not that long ago!) I wasn’t aware of the availability of computational analysis tools. At the time I did a basic textual analysis of a fairly small set of headings. Had I known about computational tools, I might have chosen a different/larger/more diverse data set to start with. What, if any, different conclusions might I have drawn from a computational approach?
As always, more questions than answers!
References
Olson, H. A. (2000). Difference, culture and change: The untapped potential of LCSH. Cataloging and Classification Quarterly, 29(1), 53-71.


