During this semester, we have been working on collecting collection of python and Instagram scripts and interacting with database.
We added the “game” function, which will be an ethos of our website, based on bootstrap. The game refers to the indexing page on the website as well. We believe the index page will show a curatorial power to the users. The game will let the participation. In this respect, our group is aiming to get more interactions. User engagement plays a critical role in this project.
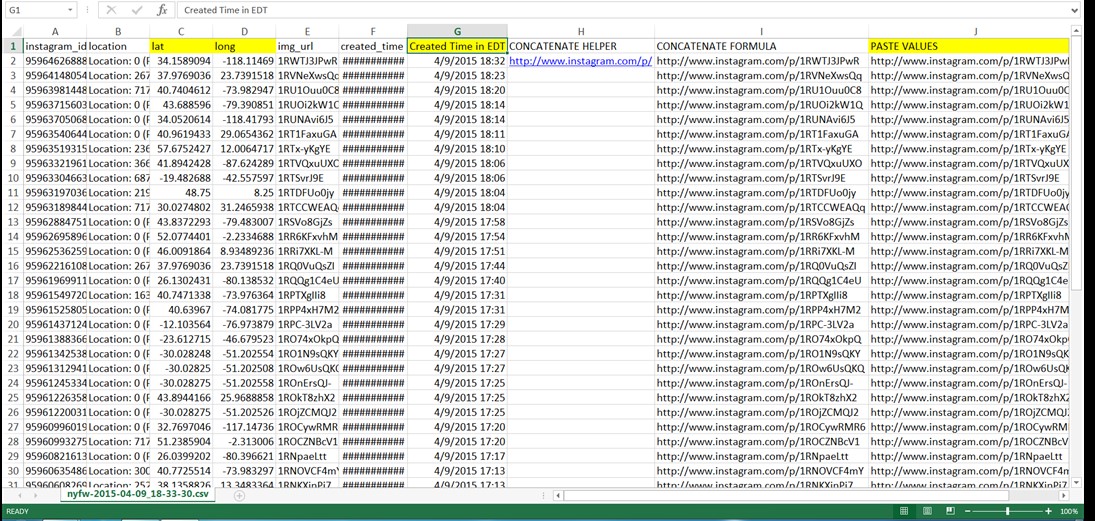
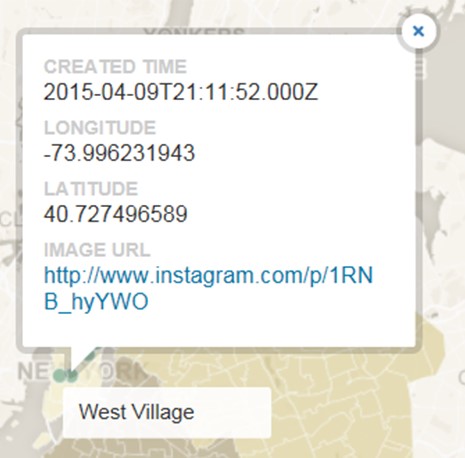
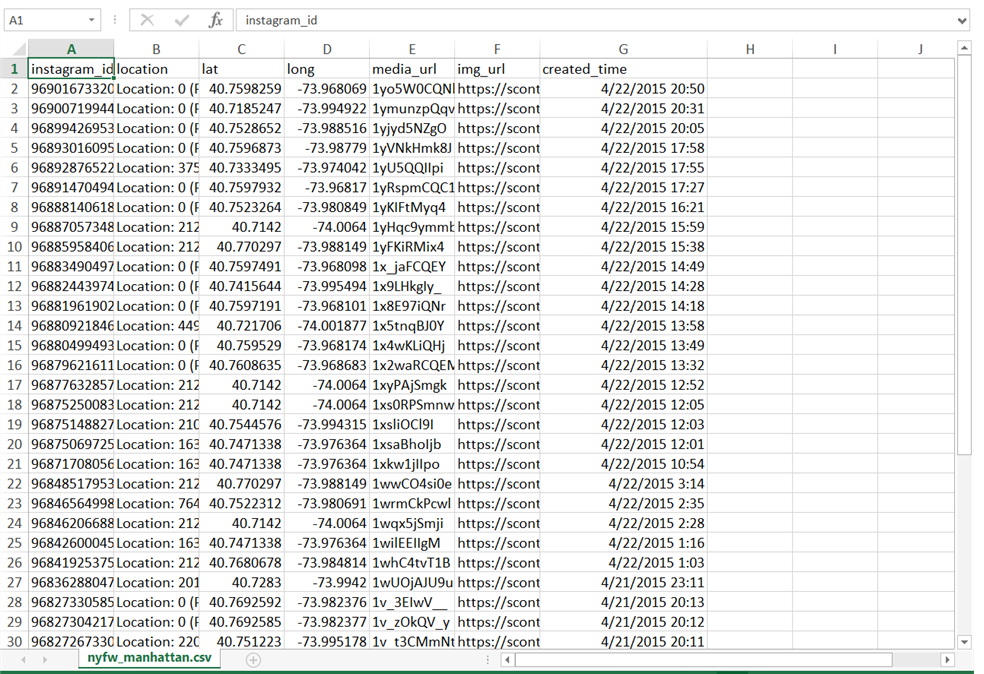
We are planning to tag more and archive more images in order to have deeper historical contents. On the images, we have to attach longitude, latitude, time information, and URLs.
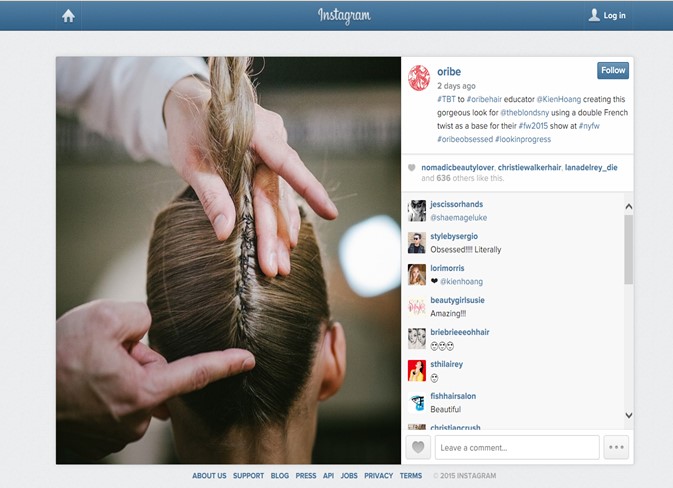
We are thinking about how we can contribute to both fashion studies students and DHers. The way we collect images pulling out from Instagram, crowdsourcing, is a totally community facilitated process. We observe latent people in community and interest. Community building is an integral part because it will generate new types of communication among different users. In the end, we will hit other parts of fashion world e.g.) Paris, London, etc. Also, we try to moderate and curate the data.
We have been discussing the possibilities and prospects of our theme in terms of layer of interaction of fashion. What extend in concern of this field? and we are questioning the power of fashion world.