Category Archives: Uncategorized

Final Wendy Davis Work

I have been working on this Wendy Davis data for a long time, but realized I had not caught you guys up to speed with it in a while. Here is what I have been doing for the past month with the data.

First, I found the data, thanks to the amazing Kelly Blanchat, who discovered it in a database at the University of North Texas.

Phase #1: JSON to CSV

Then, after I agonized over what to do with JSON files for a really long time. I found a reader for them called Sublime Text, but had trouble pasting that data accurately into a spreadsheet. Then, when I found out how to do that, I had to figure out how to make the data nice and neat, getting rid of all the punctuation that wasn’t needed in the file I would be using for Gephi. I did some of this by hand, and then found a site called Json-to-CSV that would do some of this for you. At first, this program seemed great, but then I realized that my whole file was too big to fit. The progress bar was forever stuck about an inch away from the end, but would not finish. I began to think about cutting down the data somehow, but couldn’t figure out how I would get a representative sample. Furthermore, because (as I figured out pretty quickly) JSON data do not have all the information fields predictably in the same place every time (like the way they show up in Excel) I could not do the data set in pieces, because the program could very well put the fields in different places every time, if it was working with what it considered to be more than one set of data. What I ended up doing was upgrading to their pro edition, which was like $5. In the end, however, I realized that it was the browser that was the problem. It would stall every time I tried to load the data, even though the program itself could technically handle the extra memory. In the end, I pasted the JSON data into several different spreadsheet files. Then, I cut out the irrelevant data leaving only the tweet, hashtag, and location, and pasted them all into the same spreadsheet to get ready for Gephi. Then I finally got a useful CSV.

Phase #2: Gephi

After that, I began the long haul of learning how to use Gephi. I imported my data files, which were constructed to model the relationships between the central node “I Stand with Wendy” and every other hashtag that was used in the dataset. As there weren’t that many other hashtags that were used anywhere near as frequently, it really didn’t make sense to me to model the relationships among these other hashtags. Though Margaret, the librarian who ran the library’s Analyzing Data workshop demonstrated Gephi for us briefly, I hadn’t really played around with it before. It took me a while to figure out how to do anything, because I am a very tactile learner. I kind of have to do things to understand them, and cannot get much from reading instructions, though watching how-to videos sometimes helps. At any rate, it took me a while. The hardest thing to figure out was that there didn’t seem to be any way to restore the graph to its original look after you changed the format. Also, I kept zooming in or out, and sometimes, even when I would center on the graph and zoom back out or in again, I couldn’t find the graph again.

Phase #3: The Great Fuck-Up

After a while, though, I got  something that looked pretty great to me, though because I saved it as a PDF (I didn’t yet know how to work the screen shot feature), it doesn’t look quite as great to me as it did at the time. The big developments at this stage were the decision to use force atlas, mostly because it looked best, and the decision to color code the nodes. I made the nodes blue and the edges red, creating a visualization that looked morbidly but aptly considering the subject like blood oozing, or like Republican nodes shooting from a Democratic center, simulating the geography of Texas itself.

I had taken off the labels to make the visualization clearer, and then decided to put them back on. That was when I noticed something strange. The only node that was substantially bigger than the rest (but smaller than #IStandwithWendy), was #StanleyCup. I thought it was strange that a bunch of abortion rights activists would also go crazy for the Stanley Cup, but I wasn’t discounting the possibility yet. I went back and looked at my original file, and found that the hashtag had only been used once, and my blood ran cold. Apparently, when making the edges file, I had left out the hashtag “American,” probably seeing how similar it was to “America” and thinking I already had it, therefore misaligning the edge weights, putting #StanleyCup one field further up where #StandwithWendy (the imperative as opposed to the declarative) should have been.

Eventually, I was able to laugh about this, but at the time I was pretty pissed off. There probably was a way to make these files through Gephi rather than putting in the weights and assigning the nodes numbers myself that would have precluded me from making such a mistake. I really am the kind of person who has to make mistakes to learn, though. And I learned a lot that day.

Phase #4: Something Kind of Pretty and Not Wrong

After a few more hours of work, I had something that looked a lot better (and was actually accurate this time to boot). Learning how to make the size of the nodes correlate to how many times each one was used really helped make the graph both more meaningful and visually appealing. Learning how to play around with the label font size also helped a lot, making the words correlate to node size as well, and playing around with the size so I could make as many labels as possible visible while still not having so many that viewers couldn’t read them. And I learned how to use the screen shot function, so I could take a decent picture of it. Finally, though I just had to take the labels off because you still couldn’t see anything. For your information, though, some of the most frequently tweeted hashtags (other than “Istandwithwendy”) were “txlege,” “texlege,” “sb5” (the name of the bill), and “standwithwendy.”  Unfortunately, the screen shot function does not do color, or if it doesn’t I couldn’t figure it out. Here it is:

screenshot_Wendy 2

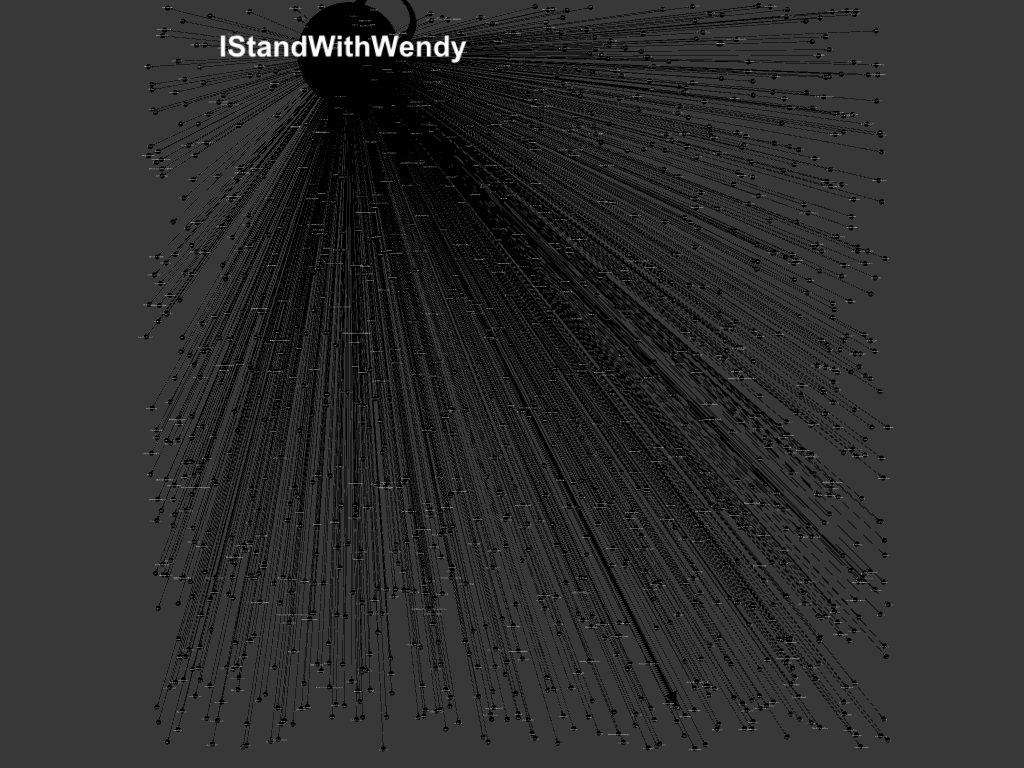
I wasn’t entirely happy with this visualization, because I am not sure it really shows very much. It shows that “IStandwithWendy” is the most frequently used hashtag, and shows that, other than that, most hashtags weren’t used that often (except for the few I just mentioned). It doesn’t show some of the interesting nuances of the dataset, like the fact that some pro-life people were tweeting “IStandwithWendy” sarcastically, and some people were tweeting “IStandwithWendy” as in the restaurant as a joke (albeit one in pretty poor taste).


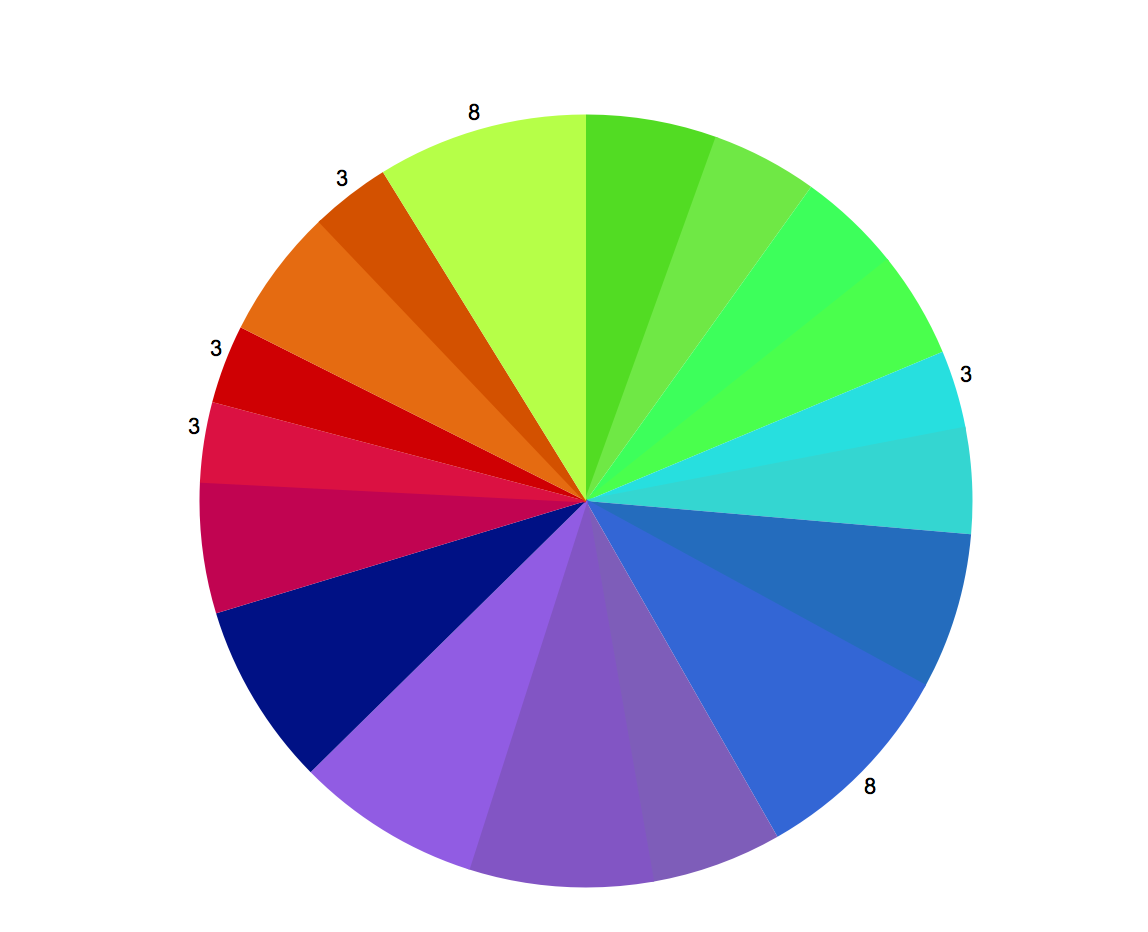
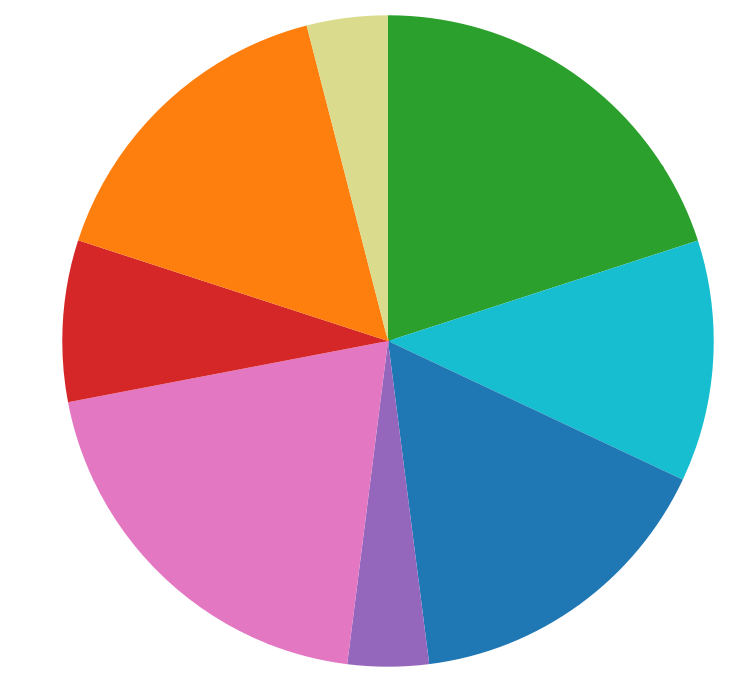
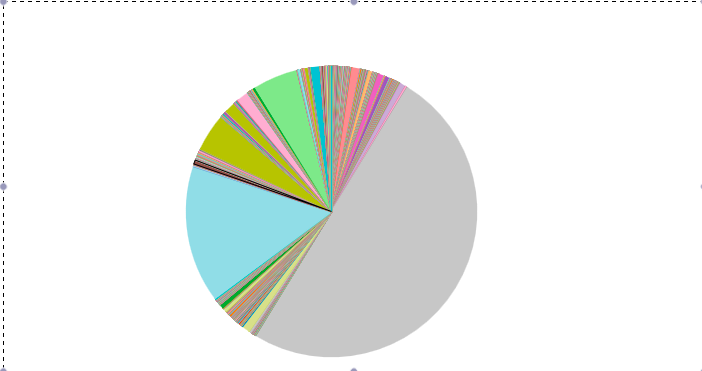
Phase #5: Tableau Public Pie Chart

Because of this drawback, I decided to make a pie chart on Tableau Public that would at least show the relative frequencies of some of the hashtags a little more clearly. I was having a bit of trouble with their export function, so I just took a screenshot, which doesn’t allow you to interact with the graph like you would have bee able to. Here it is:


Pie Chart 3

I really want to continue with this project and do the geographic map of tweets that I wanted to        do originally. Thanks, everyone for reading, and for all of the ways in which you have helped me learn DH skills this semester! Have a great holiday!

Data Project-sound and color


My inspiration of this project became from Neil Harbssion, who could not see colors. His world is black and white, but now he is an artist. Harbssion describes him as a cyborg. Dangling over his forehead is an antenna that curves up and over from the back is his skull. The device, which he calls “eyeborg”, helps him connect him and the color by detect the light frequencies of color hues and translate it into sound frequencies.

Harbission’s artwork burs the boundaries between sight and sound. He can listen to color, and also see sounds.

Here is the how Harbssion sees Biber’s Baby and Beethoven’s Fur Elise.

These made me wonder if normal people without an eyeborg could also participate into this fun with the help of software technology.

We have many phone games that are able to transform the tones, beats, and melody into colors, such as Cosmic DJ, Synesthetic, InSong, which means there is a technology to establish my assumption.

I found Harbssion’s match sheet between sounds and colors from his cyborg company and hope if there is someway I can match the color and sound frequency myself.

Harrbsion's mapping

In the beginning when I asked around my friend, nobody seemed have this kind of experience. They said the assumption sounds doable, but they do not how to do it. Finally I reached my friend’s friend, who is an artist with CS skills, she said:

“His (Neil Harbssion’s) mapping of tone to color is actually really complex, and he uses frequency to detect the nuances of colors, which is a very laborious and intense process. If you want to do it from a scientific approach of parsing frequency to color, it is not an easy process and you won’t be able to finish in time.”

However, she said, I can also fake it by assigning the color with very basic tone.

I tried several music software and finally came up with one called Mixed in Key 6.

This is a DJ software that simplifies a DJ technique called harmonic mixing. It analyzes MP3 files and determines the musical key of every file.

The basic key of each song from Mixed in Key is showing as a specific number with letter, such as 12B as E major.

mix in key 6


My datasets includes, Billboard Hot 100 from 2014 as representation of Western pop music, Melon top 100 from 2014 as representation of Korean pop music, Li Yundi’s Tokyo Concert as representation of classical music, and the sound tracks from Jersey Boys as representation of the Broadway music. By using Mixed in Key 6, I can generate the basic key into letter and match back to basic key in musical notes.

dataset sample1

After getting all the basic keys of my music, I use the tableau Public to generate the date into columns and pies.

If we distribute the number of songs with specific notes, we can see that the 4 groups of music have their own “favorable” notes.

BillboardJersey BoyClassical Jersey Boy

(from left to right: billboard, korean, classical, and jersey boy )

For billboard, it will be C minor, D major, D flat Major, D flat minor, and G major.

For Korean music, it will be A minor.

For classical music, it will be C minor and some B-flat minor, D flat, and F sharp major.

For Broadway music, it will be A major, B-flat major, E major, and F minor.

We can have a simple conclusion that note C and A seems apparent more frequent than others.

In the beginning, I used specific color to draw the pie; the color distribution looks very complex and uneven.

Billboard Korean music Classical

Then I started thinking that the match of Harbssion’s mapping has many color in similar tones, and it may be because the color has similar hue tone also reflect to the keys that sound similar for people to hear.

I modified the pies and use the same shade of the color to indicate keys also share similar hues from the map. The distributions look much better now. (from left to right: billboard, korean, classical, and jersey boy )

Billboard Korean musicClassical Jersey Boy

Looking at the second color pie, it seems all four groups have more even distribution in music tones. And because some color is more brighter, it looks more obvious, such as the orange, representing F#. There is no trend showing that people will be more in favor of one color tone. However, by looking at the pie, we can see that classical music use more F than other genres, and broadway music uses more F#. Theses four genres share similar distribution of note A (green) and D (magenta). And classical music may have more common with broadway music.


There are some limitations of this data project:

  1. Mixed in Key 6 is not a software with high accuracy to determine the basic key of a music
  2. It may be to broad or rough to only look at the basic key of a music and may mislead the interpretation of a song.
  3. Whether the dataset is representative enough

To determine whether is a real trend of music that people like to hear, further research of this project is, indeed, needed.

And it will be on my project proposal.

Violent Rap (Data Project)

Purposefully running against technology and methods of analysis in order to assert the presence of a “unique”, human validating form.

I am interested in “cultural analytics”. I also really like this music. The effects if produces as well as the mindset of the creators: It is possible to dismiss as misogynistic and hateful. True claims. But it matters to people (specifically men from 15-25)*. Unique following emerges defined through the Internet and networks of connectivity. Sometimes this manifests into real-life encounters (such as saving money to fly to California). Many times the “mainstream” websites cannot carry the videos and audio of producers of music such as this. They then take alternative routes and it would be my supposition that their creation runs through and by the eternal promise of running in opposition to the mainstream methods of distribution. Although Youtube and other content “Providers” envision themselves as at the cutting edge and key to liberality of a democracy, there is new things popping up; a contingent of dissension which demands new forms of distribution through the unacceptability of their current content. Anti-censorship. It becomes a game of searching for clues: you prowl through the Internet looking for signs, hieroglyphics really, of the wormholes around which this content congregates.

One of those areas could be the comments sections of videos. This is the video: https://www.youtube.com/watch?v=ijSoJQmLcgI. I used Voyant for analysis and the data was all the comments in the comments section of the video.

It has been said that comment sections of certain websites may be more illuminating than the content itself. The networked opinion of the hive-mind; the idea being not to “dominate” and/or provide the final say and exist as a standalone object of critical opinion, but to stir and funnel discourse through associated channels defined in the video. What I am analyzing is not an article: It is a music video. The comments clustered around the video are not surprising. They seem to mirror and/or repeat what is said within the content of the lyrics itself.

Any conclusions I reached seemed redundant and patterned on my perceptions of the lyrics as displayed from the progenitors of the video itself. Perhaps a larger dataset consisting of all comments and all related videos (as defined subjectively by me) would provide a more useful and illuminating dataset. The one thing which did stand out to me was the preponderance of the word “parents” in the comments section. The comments section can be seen as a form of metadata about whatever content is itself displayed. They all express concern for who the parents of Mike Dece are and where they came from. Thus the word “Brazil” pops up. Someone has gained access to this information through unique insider information and then spreads through channels such as this. This alters your experience of the video. You learn he is 16 and his parents are from Brazil. It is known he currently lives and works in Miami. This all becomes opinion enshrined in the hive-mind and a knowledge of which is presupposed from the “right” to comment on the video. Somehow the experience of the video is changed by knowing his parents live in Brazil and the artist is 16. Humanoid elements are added to what can on first glance seem ridiculous and/or unworthy of analysis. You become closer to the artist and others who share this exclusive knowledge with you. You feel part of a “community”.

Conclusion: the metadata contained within comments sections can alter and change a user’s experience of the content itself – bringing them closer inside the “networked circle” they seek to/have defined themselves as part of by taking the time and effort to provide a commentary.

* Subjective figure

#illridewithyou Trending

Hi Y’all,

I hope everyone’s project proposals and papers are wrapping up nicely. I’m sure some of you have been following this twitter trend, but I thought this would be interesting for those who expressed interest in twitter activism: http://www.bbc.com/news/blogs-trending-30479306

I hope everyone has a great break and happy holidays!

DH in East Asia

Basically, DH field was foreign to me because I don’t have computer science background. Throughout the class discussion, reading materials, and workshops, I ended up having a better understanding of DH. I want to share additional information from my paper.

Overall, DH has been globally stretched.
The basic methodologies of DH have been applied in East Asian Digital Humanities Institutions regarding mostly cultural and historical contents. e.g.) Taiwan, Japan, Korea

1. Taiwan.
Taiwanese DH scholars organized historical and political events through data mining and the DH scholars focused on organizing the historical materials relating to the people of China and Taiwan in the Qing Dynasty.
In addition, Taiwan founded the Digital Libraries/ Museums Program (DLMP) in 1998. This organization’s goal was to digitalize the cultural heritage and created a new program called National Digital Archives Program (NDAP).

2. Japan.

There is a proper example of how social network service worked efficiently during the natural disaster in Japan. During the 3.11 Tohoku earthquake disaster in 2011, Japanese SNS users at that time gathered the precise locational information on Twitter and were able to alarm the relief of tsunami victims.

67

3. Korea

Korea is benefited from data visualization in history department. In particular, data visualization help organizing family trees during Joseon Dynasty.

PIC7662

PIC7683

These figures illustrates the transformation form paper work to digitized form.

Korea, in fact, is known as a strong IT country, but the researches on humanity fields are largely marginalized. Overall, Korean academic puts more emphasis on Science and Technology field. DH in Korea should be balanced between computation and humanity to maximize useful information.

Link

As I have shared in the class, I am a social worker by training and am interested in looking at equity in urban education.  I also have three children ages 14, 12 and 9, all of which have had to use the internet for homework one time or another this school year.  I am fortunate that I am able to afford to have internet access at home.Unfortunately there are many children in New York City schools who are not as fortunate.  Selena and I partnered to work on our data visualization project with the intention of learning a few new things to eliminate our phobia for technology.  We also were interested in looking at public schools, their locations as they compare to where free wi-fi is located.  We both attended the Neatline workshop and thought we would use it for the data visualization project.  To our dismay, we could not figure out how to plot the data onto Neatline and decided to go with using CARTODB instead.  We decided to take our data visualization project and use it towards a proposal for a free wifi access awareness and social action project.  Our hope is to get more free wifi access in low to moderate areas for the purpose of ensuring that all children have access to the tools that will help them succeed academically.

After many hours of troubleshooting, we finally figured it out.  We are proud to show you our final product:

https://smw.cartodb.com/viz/e6095f6c-80ec-11e4-9bef-0e9d821ea90d/embed_map

Here we decided to add a Torque feature to make the map more appealing to the eye:

https://smw.cartodb.com/tables/nyc_free_public_wifi_12052014/public/map

Since some of you may be interested in using Neatline I added a link whereas David McClure gave us step by step instructions on how to to download Neatline as well as in putting data into Neatline.  I thought I would share the information for all of you:

Instructions for downloading Omeka + Neatline: (By David McClure)

Have a wonderful rest of the year!
Cindy

Big Data and the museum

Great job on the presentations, everyone! Really interesting stuff– and so diverse in topics and approaches.

I wanted to share this article that I just read in The Wall Street Journal:  http://www.wsj.com/articles/when-the-art-is-watching-you-1418338759

The article discusses the use of visitor tracking information in the museum to help make curatorial decisions. We’ve been seeing this a lot lately, using technology to track what is popular to reproduce it. It makes sense in terms of profit, but it really doesn’t leave much room for creativity and the artistic spirit, which tends to be counterculture before becoming mainstream.

Link

Hi All,

Cannot wait to see you all for this last class! I want to say that I know this is a busy time for everyone, and I do not want to add to your plate. But if you can find a few minutes to read through this request, follow the link and provide top-of-mind texts it would be immensely helpful for me and anyone else interested in analyzing this data. If this project interests you I’ll be maintaining a link to the spreadsheet on my Commons profile, so anyone can play with it.

Request:

Social Citation intends to map the personal connections that give rise to the dissemination of influential texts. At this data gathering stage, I ask that you please share with me the texts that have been significant to your work–either intellectually or aesthetically engaging in a way that was somehow transformative for you. This can be as comprehensive or as bare-bones as you like. To share the texts please follow this link: bit.ly/socialcitationdata and find your name among the tabs at the bottom of the page. Your name will appear as it is on your Academic Commons Profile. Next, list the author along side the text. Then, under referrer, the person who referred you to the text (use NA if found yourself), the location of the discovery (if outside of an institution please write city and state, if the text was encountered within an institution please just include the institution). Finally, list the duration of time spent in that place or institution. An example might look like:

Graphs Maps and Trees Franco Moretti Matt Gold_Stephen Brier CUNY 2014-Present
Hyper Cities Todd Presner_David Shepard_Yoh Kawano Matt Gold_Stephen Brier CUNY 2014-Present
Planned Obsolescence Kathleen Fitzpatrick Matt Gold_Stephen Brier CUNY 2014-Present
Feel free to use these to start your list if you care to. Thank you for your time. I will keep this link open so the data may be used by anyone to experiment with network maps and visualizations of your own.

Thanks!

The Process to Data Visualization

Cindy and I, who are not tech savvy at all, have been working with what feels like a million data sets.

Our process is outlined below:

– What we were looking for?

– How we were going to explain it?

-How it related to our research?

How were we going to visualize it?

The first question was the easiest. We knew what we wanted to share, we did not know how to share it visually. Vilem Flusser says, “Changing image to text is magical”, but I tend to think text to image can also be very magical.

Of course Step 1: attending a DH Fellows Presentation ( if you have no  clue about the software, this is the way to go)

Step 2: Working with the software to understand how it will tell your story

Step 3: going to the Data sets. the one for us was https://nycopendata.socrata.com/

Ste 4: Finding the right program for our story. For us it ended up being CartoDB, I mentioned neatline in another post,but as you will see in  the next step that did not work.

Step 5: Exporting the data in a way that it would map without a lot of commands. We tried exporting a number of data sets that did not work for us. It would import as a polygon or with null and  who knew how to georeference that? Then it would not map. Only the shape files seemed to map easily.

Step 6 : Find more data that would tell the story

Step 7: Once we found the data, finally mapping the data

Step 8: Making the data make sense for the viewer

Today in class we will show our final  project of geomapping

How ICT impacts student learning? Does income and location impact whether students can achieve?

Our project will be displayed in cartodb.

Stay Tuned


And so it continues…

Taking a scan of where we as a group began and where we stand today, I am enamored with the skills that are developing around me. From Mary Catherine’s awe-inspiring visualization of Icelandic Sagas to Martha Joy’s splintering proposal ideas, this group has evolved into a community of valuable thinkers, but more importantly valuable workers.

While I work through my own project proposal, I find more and more areas where I will need help executing each stage of development. I should be discouraged that the staff and the skillsets that are required for the success of my project is only expanding as I think through it more and more. Instead, I am excited to consider not only closer friends in the course as assets, but also people who I have yet to really chat with one on one as potential teammates.

When NYPL went around the room asking us about what we were working on and what we were going to propose, I have to admit, I went with a lame cop out answer. I hadn’t had the heart to blurt out what I really was thinking of proposing. Instead I went with some idea about a content series or something of that sort.

I have gone with a much more exciting proposition. It involves not only the study of an unexplored corpus, but also the development of a new platform for studying a particular type of media. I will explain more in my presentation tomorrow, but I thought this would be a good time and outlet to reflect on our group, our growth, and our future together.

Thank you all for being such a fantastic, collaborative, and thought-provoking amalgamation of personalities, minds, backgrounds, and insight.