If you have some spare time,
Category Archives: Uncategorized
Hypercities, History, and the Classroom
I’m an (aspiring) historian and so the turn in HyperCities to consider topics germane to historical research was a welcome one. I’m also a high school history teacher in a progressive, tech-forward school, and one of the things I try to work with my students on is to treat maps like any other document or source: that is, to identify and scrutinize them as subjective, ideology- and agenda-bearing texts. I’ve been interested in how to incorporate tenets of DH work into my own ongoing research interests as well as my classroom, and since reading HyperCities, things have started to snap into focus.
In particular, Presner’s definition of DH as “help[ing] to expose…epistemologies and world-views, ordering systems and knowledge representations in ways that foreground their incommensurabilities” struck a chord with me in terms of both research and teaching (125). When combined with his assertion that geospatial DH might usher in “an investigation of how modernity is not just a temporal designation (as in Neuzelt but also a practice of cartographic reasoning, spatial representation, and geographic persuasion and control,” there seems to be a newfound urgency to this entire project (64). History is made up of those who have tried to reorder the world in terms of space and time, often violently, and the research potential for thick mapping, geospatial analyses, or otherwise stressing the primacy of geography in one’s work are exciting.
Micki commented in class the other day that space is a place of felt values. This immediately called to mind Timothy Snyder’s incredible book Bloodlands, in which he argues for a geographic interpretation of Soviet and Nazi crimes. In examining mass murder and state destruction in terms of territory, Snyder is able to transcend conventional frameworks (national, political/diplomatic, military, etc.) and focus on what this swath of land meant to the regimes who fought so bitterly over it. To ignore the centrality of geography misses the point entirely: from 1933-1945, about 14 million people were murdered in a very specific location. Why there?
Though Snyder doesn’t take a DH route to get there, there are echoes of Presner’s idea of “geographic persuasion and control” throughout Bloodlands. It helped me think about shifting perspectives and embracing new approaches, since reinforced by HyperCities. Anne Kelly Knowles at Middlebury, and the folks at the Spatial History Project at Stanford, are good examples of researchers and historians working across disciplines to look at old questions in new ways, raise new ones entirely, and keep everything engaging. I’m looking forward to jumping into spatial analyses a bit more, which admittedly has to start with getting up to speed on the programs themselves.
Finally, in terms of my teaching, I’m trying to incorporate some DH tools and methods in line with all of the above. The first step was, during a class on European imperialism in Africa, to show them a pre-colonial map of the continent turned upside-down. That went a pretty long way in terms of helping them think about not accepting geographic representations as objective truths. Next up would be having them mark it up for omissions, biases, and so on. The question becomes: how might I scale thick mapping techniques for the high school classroom? I’m thinking of proposing an elective for next year that might be called “Geography.” It would be a history course, but through the lens of case studies as geographic events: the Great Migration; red-lining in America; the New Deal; colonial African history; the Roman Empire; the World Wars…the list goes on. But they’d all be studied, fundamentally, as events about space.
Idea for a Dataset/Project Proposal
I know this post is coming a bit late but I was so inspired by Hypercities that I had to go ahead and write about it. I have been anxiously awaiting our discussion of mapping all semester, and have not been disappointed. I was particularly inspired by the project gathering the tweets occurring during the Egyptian revolution and with Yoh Kawano’s attempt to use GIS to empower Japanese people to acquire knowledge of the radiation in a given area in the wake of the Fukushima disaster. It was a bit of a revelation to me to see scholars taking on projects that will really help people outside of academia, and that have such personal relevance for them.
Reading this also gave me an idea of what I would like to do in DH—possibly for my dataset project or my large project proposal. I would really like to harvest (?) locational data about the tweets sent last August in Texas during a few of the hearings, and protests, related to House Bill 60, as well as Wendy Davis’s filibuster. These bills which came up for debate in the Texas House and the Senate at this time aimed to severely restrict Texas women’s access to abortion and other reproductive care. These measures (which I believe have now been partially put into effect) disproportionately affect the many Hispanic women living in South Texas, where virtually no clinics were able to remain open, and working class women, who cannot afford to take off several days or more to travel the long distance now necessary to get reproductive care. In a state that takes eight hours to drive across width-wise and probably more to drive across length-wise, there are only seven abortion clinics left—all of which are located in Texas’s few and widely scattered urban areas.
As you can see, geography has played a big part in which women have been affected by these laws. However, geography also played a role in whose voices have been heard in the protests, and whose have been silenced. There is a wide perception that Austin is the only area of Texas with a significant liberal population, and that the rest of Texas is hyper-conservative. While this may be true to a large extent, I believe there are pockets of people all over Texas who strongly opposed those measures, and whose voices were marginalized and trivialized when Rick Perry said the protesters did not represent “real” Texans. Though indeed many protesters present were from Austin, there was substantial opposition to the measures on Twitter as well—a medium which, while it certainly is not accessible to all Texans, provided a relatively efficient and economical alternative to in-person protesting. I think plotting on a map the frequency of use of certain hashtags popular in these events such as #standwithwendy and #comeandtakeit might give voices to these silenced people, dissipating the feelings of hoplessness and isolation that come with being a liberal person in Texas, and providing a convincing illustration of the extent to which the Republican leadership of Texas in promoting measures like these, ignores the wishes not only of liberals in Austin, but of a much wider portion of its constituency. This project was very important to me because I was actively involved at the time and feel the need to help, though I no longer live in Texas.
It seems like I will definitely have to learn about APIs, and maybe some kind of mapping software. This may be a very large project I am aiming toward, but if anyone knows what other skills I might need to get started, I would be very much obliged for your input!!!
Dataset Project: Testing Gephi
I found the projects on the Visual Complexity site really beautiful and interesting, and I was inspired to start playing with Gephi in anticipation of using it for my dataset project.
I’m happy I started early! I downloaded the most recent version of Gephi and went through the tutorial using the Les Miserables sample dataset with no problems. I figured since that was so easy, I’d go ahead and visualize my Facebook network, just for fun.
I used Netvizz to extract my FB data. I immediately ran into problems getting the data into a format Gephi could read. Netvizz says to ‘right click, save as’, which wasn’t actually an option. Ultimately I opened the .gdf data in the browser, cut and pasted into a an Excel file to save as a csv, and also pasted the same data into a text file and saved. The Excel csv data would load into Gephi, but the IDs and labels were all wonky, and the graph was clearly a mess with number strings as node labels. I then tried the text file, which threw up error an message and wouldn’t even open. Some amount of Googling & trial and error later, I discovered I had to change the format to UTF-8, and change the file extension from .txt to .gdf.
Once that was sorted, I had trouble displaying the data in ‘data laboratory’ view of Gephi. I eventually discovered that Macs (or maybe just my really old Mac) are not, for some reason, entirely compatible with the current version of Gephi. OK. Uninstall the current version, re-install an older version. Fortunately that solved that particular problem.
So! Eventually I was able to get the data to open properly, and the graph to start looking like it should. I used the same steps from the tutorial to create a graph of my FB network. This part was easy, as it had been with the sample dataset–just following the instructions for a really basic visualization. Beautiful.

Feeling emboldened by my problem solving and subsequent success, I started to play with a small part of my (anticipated) dataset. Several hours (and one trip to the grocery store) later, I’ve not been able to get the data into the proper format so that 1) Gephi will take it, and 2) it will display connections correctly. I can get one or the other, but not both.
This will definitely take more research & finessing, but I’m hopeful that I will be able to get it all to work. Stay tuned for the scintillating conclusion!
Some other good Python resources
Just wanted to add to the list of good resources for (teaching yourself) Python:
Learn Python the Hard Way and the Code Academy Python tutorial, both mentioned in the previous blog post, are both excellent (and free)–both are interactive (which I’ve found to be *hugely* helpful in writing code that actually runs (instead of spending ages rewriting the thing before realizing the problem is something mundane, like a missing colon)) and LPTHW is rote (i.e., typing out the prompt code verbatim) which, unlike pretty much any other examples of good pedagogy, I’m finding to be a pretty good way to learn this stuff.
Another very good resource (which is also the book assigned in my computational linguistics class) is John Zelle’s Python Programming: An Introduction to Computer Science, which can be accessed for free at http://www.maths.nuigalway.ie/~gettrick/teach/cs102/pythonbook.pdf as well as Zelle’s companion website, which has slides and downloadable code for all the program examples in the book: http://mcsp.wartburg.edu/zelle/python/.
There’s also learnpython.org, also with an interactive function (in addition to countless examples and explanations) and an MIT open courseware class, A Gentle Introduction to Programming Using Python: http://ocw.mit.edu/courses/electrical-engineering-and-computer-science/6-189-a-gentle-introduction-to-programming-using-python-january-iap-2011/, which I haven’t yet looked at but appealingly promises to be a “gentle, yet intense, introduction” to programming.
Python Workshop
The Python Workshop last night was SRO, with members of our class occupying about a third of the seats (including some who had been on the wait list). Given the complexity of the subject and the short time, the class barely scratched the surface of Python Programming, but it was a start.
For those interested in other Python learning opportunities, I would mention several. First, the workshop instructor named two books: Python for Kids by Jason Briggs (good for those who have zero prior exposure to programming) and Learn Python the Hard Way by Zed Shaw for those who have some familiarity with coding.
There are four Python classes on Lynda.com. I have not taken any of them, but I have taken other Lynda.com classes and they have all been good.
I can also recommend Coursera, which offers a Python class.
Finally, classmate Chris Vitale shared with me a link to Code Academy, which I will pass along. http://www.codecademy.com
Happy coding!
DH Box Overview/OCT. 9th
I was only able to stay for the first half of this workshop so it would be great if some other folks who attend chime in as well.
Here is the DH Box website: http://dhbox.org/
Right now it seems as if the tool is particularly useful for teaching DH tools in the classroom. For example if you try to teach a workshop on Omeka (an online catalog/exhibition tool) and you are using rented lap tops or a computer lab where you do not have the ability to download software, DH box will allow you to use Omeka through a browser. DH box is still a bit new and requires some comfort with command line interactions. There is a lot of documentation online. This is what I gathered I hope other friends will add more comments about what they learned.

“Postdigital”?
 Richard Dupont, Untitled #5, 2008
My roommate came across this exhibit after we’d had a somewhat snarky conversation about post-colonialism and postmodernism. Just curious what people think about “postdigital”.
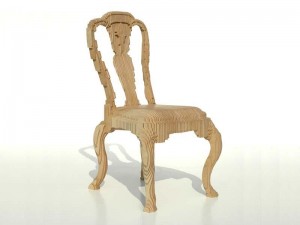 Julian Mayor, Clone Chair, 2005 photo by Topaz Leung
Here is the museum blurb about the exhibit that went up at The Museum of Art and Design last October and showed through June. Did anyone see it?
http://madmuseum.org/exhibition/out-hand
Out of Hand
Materializing the Postdigital
October 16, 2013 to June 1, 2014
About the Exhibition
Out of Hand: Materializing the Postdigital will explore the many areas of 21st-century creativity made possible by advanced methods of computer-assisted production known as digital fabrication. In today’s postdigital world, artists are using these means to achieve levels of expression never before possible – an explosive, unprecedented scope of artistic expression that extends from sculptural fantasy to functional beauty. Out of Hand will be the first major museum exhibition to examine this interdisciplinary trend through the pioneering works of more than 80 international artists, architects, and designers, including Ron Arad, Barry X Ball, Zaha Hadid, Stephen Jones, Anish Kapoor, Allan McCollum, Marc Newson, and Roxy Paine. Represented are some of the most compelling creations from the past decade ranging from sculpture and furniture to fashion and transport.
Organized by MAD curator Ron Labaco, Out of Hand will be on view at MAD beginning fall 2013 (October 16, 2013 to June 1, 2014). It will be the first museum show to consider the impact of these new, revolutionary methods of computer-assisted manufacture on fine art, design, and architecture, and will introduce the public to the imaginative expression that these emerging processes enable. Through this exhibition, MAD will explore a monumental transition in the way human beings understand creation, from the earliest objects conceived and produced by individual makers through the tools of technological innovation. Today’s digital fabrication methods such as 3D printing, CNC (computer-numerically-controlled) machining, and digital knitting unite divergent artistic approaches, offering new opportunities for individual artists, architects, and designers to integrate these skills as vital part of their personal creative processes, representing the fruits of a new movement.
The exhibition will be accompanied by an active roster of public and educational programs, from workshops and lectures to curriculum-based programs serving K-12 students, as well as in-gallery interactive stations. A series of master classes featuring the designers and technology including in the exhibition will be scheduled, programs designed to engage visitors in the creative processes of artists at work and to reveal the far-reaching potential of many of these new technologies.
Major support for Out of Hand: Materializing the Postdigital is generously provided by the National Endowment for the Arts, Creative Industries Fund NL, and Infor. Additional support has been provided by Dassault Systèmes, the Dutch Culture USA program by the Consulate General of the Netherlands in New York, Toyota, the New York State Council on the Arts with the support of Governor Andrew Cuomo and the New York State Legislature, the Flemish Agency for Arts and Heritage, and Design Flanders. Major in-kind support for the exhibition has been provided by Shapeways and LuciteLux. KLM Royal Dutch Airlines is the official airline of MAD.”
-Jojo
Alt-Ac Blog
Hello all,
This does not have much to do with our reading per se, but I think y’all will hopefully appreciate it anyway. I found this blog on the Chronicle of Higher Ed about alt-ac careers–a topic about which I have been curious for a while: http://chronicle.com/blognetwork/researchcentered/2013/08/08/advice-for-aspiring-alt-acs/. The first post gives advice to aspiring alt-acs. Though I am not sure I know more about what alt-ac careers are after reading this, it at least made me feel better about not knowing, explaining that serendipity and chance often play a big role in alt-ac jobs, and that the parameters of what constitutes alt-ac are not rigid or even particularly well-defined. Hope y’all enjoy!
Interesting piece on Moretti
After our class discussion last Thursday, I went back to find this piece on Moretti by Elif Batuman (who overlapped with Moretti at Stanford) and thought to post it. I found the discussion of Moretti in context of Russian Formalism particularly interesting.
“THE DARWINIAN THREAD is taken up in the third chapter, which opens with an evolutionary mystery: how can we understand the survival of Sherlock Holmes, as opposed to the failure of the other fictional detectives of his time? Again, a triangle: instead of Conan Doyle and his readers—Conan Doyle, his rivals, and his readers. In search of answers, Moretti and his team of graduate students dove into the archive of Victorian detective fiction and resurfaced with 108 long-forgotten rival texts—which, after appropriate analysis, yielded the secret of their own extinction: their authors didn’t know how to use clues.”
