NYC Fashion Index: Team Report

NYCFI_logo_2nd

Currently, our team focuses on technologies and outreaches. We created the lists of taglines related to fashion and sprezzatura.

Developer -Tessa

Decided to use Python  as the programming language to pull big image data sets.

Installed homebrew for more productive data mining, interm, and Text Wrangler.

Made a github account and linked github to my terminal with an SSH key

Cloned the repository for python for instagram

Next Steps:

Download free database (possibly postgres because it has geotagging functionality built in)

Use python and text editor to get images and metadata into database
Use django app and python to build front-facing site

Outreach -Renzo

Created instagram and twitter accounts.

If you are interested please follow @nycfhasionindex

Designer – Min 

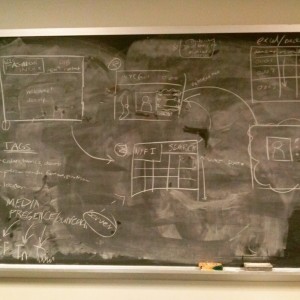
Designed the logo and prototype of the webpage.

Setting up placeholder web linking to social media platforms (twitter, instagram, tumblr)


Overall, we are setting up the reclaim hosting.

Digital HUAC – Workplan & Wireframe & Update

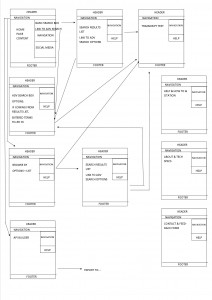
Wireframe:

wireframe

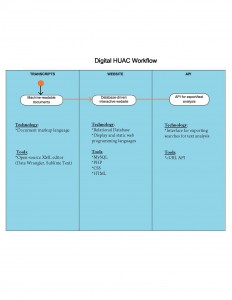
Workplan:

Digital HUAC - Workflow_Page_1

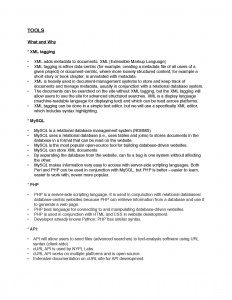
Workplan: what & why

Pages from Digital HUAC - Workflow

Workflow 

The documents (which are already scanned) will be manually tagged using an XML editor according to identified categories, then read into an open-source relational database (MySQL), which reads XML documents. The MySQL database will be incorporated into the website using PHP in conjunction with the site (syntax—PHP within the HTML/CSS site schema). Finally, the API will allow users to export their searches to text-analysis resources.

Historians and Corpus

We’ve identified a number of historians, librarians and archivists, and digital humanists to potentially work with on this project and are in the process of reaching out to them in an advisory capacity. We seek guidance on our taxonomy and controlled vocabularies in the short term, and on future developments of our project beyond the scope of this semester.

At the top of this list are historians Blanche Cook and Josh Freeman, CUNY professors and experts on the HUAC era. Steve Brier is in the process of introducing us to both Cook and Freeman. Other historians include Ellen Schrecker (Yeshiva), Mary Nolan (NYU), Jonathan Zimmerman (NYU), and Victoria Phillips (Columbia), each with subject expertise and research experience on the time, events, and people central to Digital HUAC. We have also identified Peter Leonard, a DH librarian at Yale; David Gary, the American History subject specialist at Yale who holds a PhD in American History from CUNY; John Haynes, a historian who served as a specialist in 20th-century political history the Manuscript Division of the Library of Congress; and Jim Armistead and Sam Rushay, archivists at the Truman Library, as potential advisors.
We have narrowed down the corpus of text that we’ll be working with to include 5 transcripts: Bertold Brecht; Ronald Reagan; Ayn Rand; Pete Seeger; and Walt Disney. This list of major cultural figures spans the hearings themselves and features both friendly and hostile witnesses, offering users a varied look into the nuances of interrogation. It is our opinion that by focusing on a witness base of recognizable figures that is thematically organized, users may examine their testimony as individuals and in context with one another. This quality of the HUAC hearings cannot be understated, and Digital HUAC seeks to draw attention to it through the overall user experience.


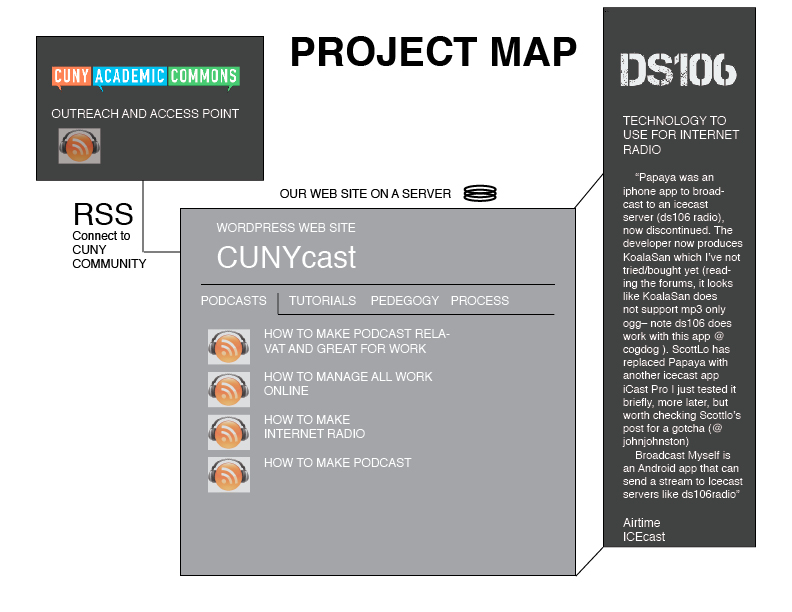
CUNYCast PROJECT MAP

ABSTRACT:

CUNYCast is an online experimental podcast in the Digital Humanities.  Project organizers will record content, make it available online, document the process, and create a “how to” manual for future podcasters, eventually encouraging others to contribute to a network of podcasts. CUNYCast is free, open sourced, collaborative, interdisciplinary, and shared. It is more than a single project; it is an initiative that offers students and faculty the tools and knowledge they need to share their work through audio. It can be used in classes, workshops, clubs, or as a stand-alone project to enrich not only the community at the Graduate Center but also the community across all CUNY schools. A link from the CUNYCast group page on the Academic Commons will lead people to an external site where content will be hosted. Links will also connect participants to resources that encourage information sharing, and cooperative production through CUNYCast. The CUNYCast site will be hosted via WordPress, which supports audio, video, and a number of other easy to use plugins. It will also implement source code from ds106 radio, and be powered using Icecas; a streaming media server. CUNYCast can enrich the long commute to the city, whether it is by train or car, or can be enjoyed from the comfort of home, when one is sick and unable to get to class. It is a low cost project capable of producing content and knowledge for individual classes in the future while encouraging community connection. CUNYCast’s aim is to empower a DH community on demand; one that anyone can participate in.

USER STORIES:

Digital Humanities student:

In the new world of multimedia scholarship students are looking for new modes of production. They may ask themselves, “How can I reach a larger audience with my academic work and discoveries?” Publishing in academic journals is an integral part of academia but in an increasingly open source world how do graduate students reach out to wider communities to create digital content? A digital humanities student can tap into the CUNYCast web presence to learn how to make a high quality audio/digital repository. The student will learn different ways they can host their work, including requesting a block on the CUNYCast site. The student can also browse other CUNYCast programs (or more directly, ds106 programs) to see the open and conversational ways Digital Humanities scholarship shows a process-documented approach to scholarship. The WordPress production and code will be shared and easily accessible for student learning.

CUNY Faculty member:

The CUNY faculty member is interested in opening up digital publication opportunities for their students. Instead of a traditional end-of-class paper, the professor may want students to produce something that will exist online so that students can share their scholarship in a wider community and create their online academic persona. This faculty member would use CUNYCast to show students how to produce and post their podcast final project. The CUNYCast would also include documentation about the pedagogical practices being formed around digital media production in the classroom.

Outside Non-Affiliate interested in Podcasting:

Academic publishing and information has historically been a closed system where information seeking community members and independent scholars have to jump through hoops to get access to the most current and revolutionary scholarly work. This non-affiliate could look toward CUNYCast, and learn how to create his or her own online digital podcast publication. Here, they would be able to see how investigative and scholarly podcasting practices have their techniques outlined.

Technical Specs:

  • We are building an open online course in Digital Humanities. Documentation and technical explanations will be available to GC users via the Academic Commons.
  • Web hosting
  • Icecas Account
  • WordPress A/V Plugins, including Soundcloud
  • RSS
  • Airtime
  • ds106 Radio
  • Recording Equipment
  • Audacity (open source audio editing software)

Cunycast

Fashion Index (Sorry…I accidentally deleted the posting)

The Team:

Min: Designer

Tessa: Developer

Renzo: Outreach

You Gene: Project Manager


Abstract


In this project we will fundamentally navigate what people wear in their daily life for the sake of function and beauty, and how they like to show it off to the world through the internet. Fashion has a long history, but today fashion due to the rise of the Internet and SNS (Social Network Services) fashion now has a chronological narrative. In particular, instagram provides an enormous amount of images as people post their daily outfits. The collection of images can be indexed and achieved. As a result, it becomes a fashion trend with a wide range of colors, patterns, and styles.


Our methodology is creating a visual timeline of fashion trends in New York based on harvesting the keywords and geospatial data from instagram. On instagram, we will focus on collecting and analyzing hashtags taken in New York, specifically one hashtag, “sprezzatura.” To do data mining, we will mainly utilize API, which provides statistics and help analyzing the trend and popularity. We also want to emphasize a user friendly aspect to the design of the final project with the possibility that viewers will come to the site and see a wall of photos and clicking on one would bring up information and statistics linking it to other photos.


The main audiences for this project are people who belong to fashion communities, including designers, fashion journalists, and those interested in fashion studies and trends. Yet, there is no social index of fashion images. We pursue our goal that this project will lead to create a new social index for fashion. We also aim to create a lively updated visualization datasets what we have collected. In addition, our goal is to define and investigate future fashion trends by looking back our fashion chronology. We expect this project will bring fashion into the dialogue of digital humanities and open up interdisciplinary possibilities between digital humanities and fashion studies.

Keywords: fashion, instagram, data mining, API, social index, sprezzatura, fashion trend, visual timeline

Environmental Scan:


Fashion acts as a barometer of popular tastes, social trends, and socio-economic climate of a place and time. Significantly, fashion schools in New York including MAD, Pratt and Parsons New School reflect scholarly approaches in fashion studies. Social Network Services, especially Instagram, Twitter, and Snapchat capture the now and at the best of time it can represent a momentary unified cultural experience, or at worst, fleeting moment to moment frivolities demanding your attention.


As of December in 2014, Instagram reported there were over 300 million unique users uploading more than 70 million photos and videos every day. The New York Times deemed this phenomenon as “fashion in the age of Instagram.” A new era has arrived where digital media is changing not only the way clothes are presented, but even the way they are designed. Active users help enriching and indexing databases by interacting with images and videos in real time. For example, if an Instagram user tagged an image with #sprezzatura, this image would function as the index on the site. Then, he or she  would search the image and check if it matched with one’s own standard.  If three users negate the image, the images would be discarded from the historical timeline. Unfortunately, these types of applications are not designed to an archival study in mind, so all the pictures taken can be outdated and lost. Although new digital tools offer novel access to capture and share images, they do not include the voices of individuals or trends outside the mainstream fashion world.


Recently, a proliferation of fashion forums as known as thefashionspot.com and lookbook.nu allow to share the snapshots and comments on current fashion trends. Although these sites host a wealth of fashion community images, they are often niche curated by fashion experts. Fashion has developed as a history told by the victors, meaning the designers and brands that endure financially and the celebrities they dress, while leaving small designers out of the narrative. There is no fashion social index on fashion images. Thus, we pursue a big data-drive look for fashion timelines which has not been operated by fashion experts. Instead, we will aggregate the imageries which help produce and discover new types of fashion languages. Franco Moretti discussed this aggregation approaches in his book Graphs, Maps, Trees that “the lost 99 percent of the archive and reintegrating it into the fabric of literary history.”  In this context, we will bring the 99% of the forgotten fashion archives and replace it into the dialogue. This project will lay the groundwork for how we can capture snapshots in fashion at a specific time and place.

What problem does this solve?


This project provides a more permanent snapshot of rapidly changing fashion trends by pulling them from sources that are not designed with archiving in mind (Instagram). The internet has this simultaneous problem of hanging around forever while also being here today, gone TODAY.


What lacuna does it fill?

In cities like New York there is a constant demand for data on fashion tastes and industry.

By Aggregating scattered sources of data and crowdsourcing we will create a more unified view of fashion in New York in a way that was previously unfeasible due to a lack of archiving.

Issues of broken images and credibilities of data.


What similar projects are there?

There are ongoing projects to digitize fashion records, namely the Vogue Archive, The Women’s Wear Daily Archive, and the Council of Fashion Designers of America Archive, but each of these are institution-specific. The Bloomsbury Fashion Photography Archive, part of the Berg Fashion Library, is in the process of archiving over 600,000 images indexed by expert scholars, but these images are mainly comprised of runway photos from the Niall McInerney Fashion Photography Archive. There has been a proliferation of fashion forums in recent years, such as the thefashionspot.com and lookbook.nu, where fashion enthusiasts gather to share photos of themselves and comment on current fashion.

What technologies will be used?

Instagram API- data  mining- digging instagram, spatial analysis, some basic website building tools like WordPress. Integrating analytics data into visualization.

Which of these are known?

Data, layer verification, indexing, database, tags, the NYPL picture collection


Which need to be learned?

We need to learn how to yank the API from Instagram through Apigee, better understanding of analytics integration and UX design.

How will the project be managed?

Documents and communication will be retrained on Google drive, but we’re also considering looking at the Graduate Center Redmine.


Milestones

Week 1: Gathering the team, organizing roles, defining tasks

Week 2: Website mockup draft and project text and branding drafts

Week 3: Website live with project description and placeholder for indexing interface

Week 4: Social media accounts live, project promotion begins

Week 5: Instagram API loads into indexing interface

Week 6: Users can interact with indexing interface to tag and validate images

Week 7 – 10: Ongoing indexing and data cleaning

Week 11: Initial visualizations prepared

Week 12: Final visualizations uploaded to website

 

Fashion Index User Stories

IMG_20150217_221537


Fashion studies is an interdisciplinary academic field. We believe it strongly bridges to social science areas including sociology, anthropology, and psychology.  People who came from fine arts and design studies as well as those who have social science background of studies will show integrating interests to our project.

1. Socioeconomic scholars

They will analyze data from instagram based on geographic information, neighborhood, and economic status. Instagram users tag their location and brand of clothes once they post their ootd (outfit of the day).  Based on the information, socioeconomic scholars can predict the users’ economic climate. Depending on neighborhoods and districts, people dress differently. Thus, dress code symbolizes the occupations along with the social classes. Certain clothes are dressed in special occasions to discuss social or political issues and to give messages.

2. Psychologists

Fashion is a form of expressing oneself.  Psychologists can predict what certain groups of people want to express through their clothing. They can also read the psychological fabrics of the people   through patterns, colors, and styles. What’s more, fashion is deeply related to the psychology of the consumers, and psychologists can analyze and predict its trend.                  Personal style without chasing the trends defines one’s identity through what one is wearing and reflects strong points what looks good on one’s body shape.

3. Costume Designers

They work on the design of items of clothing  and pay attention to specific reference materials especially textiles and colors. They will get inspiration to design their clothes for the performers especially from film and broadcasting. In particular, costume designers are responsible for overall look of the clothes and costumes in theatre, film, or television producers. They need to have excellent design skills as well as organization skills to lead the team. They should also reflect the socioeconomic and psychological aspects of the people’s life in different backgrounds.

In this project, we aim to provide straight facts about the who, what, when, where. The tags will be listed by either the initial user or added by crowdsourcing.

TANDEM USE CASES

Publishing Case:

Chris is a Data Analyst for the Advertising department of XYZ Publishing. He has the banner ads from this year’s holiday campaign. He is interested in analyzing what generated the highest click-through rates for the company. Chris has previously downloaded and installed TANDEM to his desktop tool. Chris drag-and-drops his folder of ads onto the TANDEM interface. A progress bar appears. A .csv file is generated in the backend to store the output. The completion page gives Chris a downloadable CSV. Chris is directed to brief guides on how the data could possibly be used/visualized. Chris goes the basic route and enters excel to explore his data. He compares the data to the clickthrough rates in the ad server and notices a trend in the relationship between brightness and saturation, along with the number of words on the advertisement, and how many users clicked the ad. The brightest ads with 10 words or less had the highest click through rates. Chris is able to make an data-driven argument with the design team for brighter ads with minimal text in future campaigns.

Scholar Case:

Professor Plum is studying how advertising strategies have been affected by a significant historical event such as World War I. He has collected a corpus of print advertising materials spanning multiple product categories both before and after the event which is being studied. Plum wants to know what has changed and has developed theories regarding a number of features among which are the following questions:

  • Has the proportion of text to image changed? How?
  • Has the word usage changed? How?
  • Has the iconography changed? How?
  • How has the visual style changed? Are the different colors being used? Are the images more contrasty?

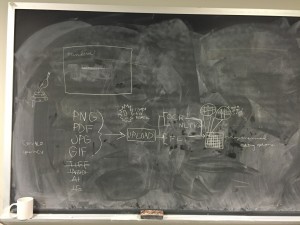
Using a tool outside of TANDEM, Professor Plum scans the materials into a digital format such JPG, TIFF, PDF or GIF. After the image files have been built, he downloads a copy of TANDEM from the Internet and installs it on his desktop computer. Plum launches TANDEM and starts the analysis process by inputting the name of the folder that contains  the electronic documents being studies. TANDEM outputs OCR, NLTK and FeatureExtractor data into a database, which can be saved.

Professor Plum can now use TANDEM (or some other visualization tool) to produce visualizations or tables on the parameters that are of particular interest to the scholar. Based on the results of these visualizations, Plum may make some adjustments to the settings in TANDEM to produce a more useful result. He may choose to export the results database to another application for further work or study.

Educator Case:

An early childhood educator, Yasya Berezovskiy, wants to study the effects of children’s literature on neurological development, exploring factors such as narrative, image representations, and lexiles (or word complexity/reading level) together. To date, Berezovskiy has worked with empirical evidence and collected fieldwork data.

Berezovskiy will be analyzing a number of children’s books with varying factors, ranging from author collections, time published, and theme.

Using TANDEM Berezovskiy can upload page images or entire works to process the work’s text in comparison to the visual information. Once complete, Berezovskiy can visualize the processed files in split screen, with the original image beside the visualized data. From there, Berezovskiy can choose to isolate individual elements to analyze, such as opacity, density, text to image ratio, text to color ratio, shape to text ratio, and more. Alternately, Berezovskiy can download the raw processed data to analyze using a separate visualization program.

The processed data will be complementary to other observational research being done by Berezovskiy’s colleagues. Without TANDEM, the evidence from the children’s books would have been only descriptive. Further, without TANDEM it would have taken Berezovskiy multiple programs and more effort.

Fairy Tale Nerd Case:

The user, a woman interested in creating a datavisualization for a pop lit site like Toast.net — let’s say Ella, wants to look at Victorian illustrated fairy tale collections. Ella wants to analyze captions for art plates in all available published works. She wants a computer to process all available picture books to give her more information on the content of a work based on its visual properties as well as its textual content. She wants to get a computer to pull all the words included in the illustrations, as well as the ratio of those words in relation to what is written in the story (Are they direct quotes? Are they distinct?). She goes to the TANDEM interface. There, she sees a simple description of what files the application will yield. It’s so understandable! All the fields are so well explained! She clicks the upload button, finds the files on her computer, uploads the picture book scans, and runs the application. Once the TANDEM program has run, another window appears offering a number of file types. Each file type has a scroll over description of its applications and recommended datavis links. Once she has selected, she can download the data file (CSV or …. …..).

Ella takes it to her favorite datavis site and goes wild with joy at the new capabilities and bases for comparison. All her dreams have been answered. Thanks, TANDEM!


HUAC User Stories

User Story #1: A forensic computational linguist doing research on how interviewing style impacts witness responses. The value of the site to the user is being able to compare friendly vs. unfriendly witnesses (difficult to determine in general court transcripts) and the sheer number of available court transcripts available (also difficult to collect re general court transcripts). The person clicks the API link and follows the prompts to extract a cluster of readings from unfriendly witness testimony, and does a second export for a cluster from friendly witness testimony. The API exports the two corpora into an intermediary location (such as Zotero), which can be used with Python (NLTK) to compare, for example, the number of times interviewers repeated question for friendly vs. unfriendly.

User Story #2: High school civics & US history teacher, Chris. He is wants to assign the students to search the archive to find primary source documents from the McCarthy era. Students will have a list of topics and names to choose from as their research areas. Chris tests the site to see if it will be useful to his students. Chris uses the simple search box to search for both topics such as ‘treason’ and ‘democracy’. Chris uses the advanced search options to combine topics with names.  Chris is looking for clean results pages, the option to save and export searches, and help with citation.

User Story #3: American Political Scientist, Jennie, doing research on US government responses during periods of perceived national security threats. Specifically, she is interested in the Foreign Intelligence Surveillance Courts (FISC), which are closed courts. Jennie wants to read about now-released documents that record the conduct of closed courts. Jennie wants to do mixture of qualitative and quantitative analysis. Qualitative: Jennie uses the advanced search to specify she wants only to look at hearings that have been identified in the category as ‘closed’ hearings, then does the same to specify only ‘open’ hearings. Quantitative: Jennie uses API and follows the prompts to extract data with the category ‘closed’ and date filter to do a statistical analysis of number of closed trials by year and how/if correlated to outside events.