Tag Archives: dhpraxis14

@jojokarlin’s Memory Trip pre-pitch

I am massively intimidated by the awesome pitches people are composing so concisely! I feel like Little Red in Into the Woods— scared, well ExcITED AND scared. I offer a rather hasty outline of what my pitch might be on Tuesday…

Memory is tricky stuff. In these digital times, it is a tradable commodity. How many gigs is your phone?

I want to create a memory map of my grandmother’s memory (loosely based on the map of a road trip) and in the process model a platform that others could use to assemble their own memory map with elderly relations who are not particularly digitally inclined. (My grandmother buys disposable wind up cameras).

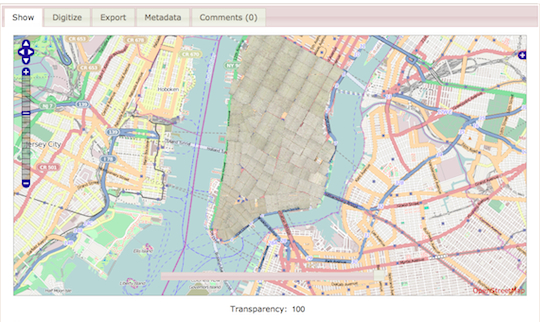
1. Memory Map—  I am interested in modeling, in a map of sorts, my soon to be 97-year-old grandmother’s remarkable (largely pre-digital) memory. The Dodge ad from the Super Bowl somewhat made my argument for tying my grandmother’s memories to a road trip. She’s been driving a long time and her life almost spans the history of the automobile industry in America. Not only is the road trip a tradition I have with her, time in the car tends to be fairly meditative. The metaphor is useful — roads more and less traveled in life take us down paths we maybe remember– and the project becomes more memory tourism than memorial monument. (I don’t want to build a museum or a family archive — it’s not about ossifying the “true” facts of my grandmother’s life. I want the map to be an interactive spatialization of the way memory from all her years live in her today.

2. Platform for others to use– I have been thinking it should be done in Neatline with some fancy plugins. I would love to make something that doesn’t require elaborate tools for data collection (I’ve done initial interviews and video with my iphone). Ideally, once built, the memory map could be available to people wanting a way to digitally document the way older generations go about remembering.

IMG_1375

I offer a photo of my grandmother at the Getty Museum — I bit their social media bait and had her pose and tweeted it. Naturally @theGettymuseum responded:

Screen Shot 2015-02-08 at 7.05.35 PM

I would like to help my grandmother continue to win the internet.


#Skillset Renzo

Outreach & Project Management: My current passion project is producing a YouTube series where I interview artists, publishers, and creators working in comics. So I have to stay abreast of what artists are big, who’s up and coming, and what are the new trends. Then I have to find those people that are now or soon will be movers-and-shakers and convince them to sit down and talk to me, then work with my editor to make something watchable. So keeping this going feels a bit like outreach and project management combine.

Developer: I have a modest knowledge of Photoshop from running a little blog about old Japanese magazines. Other than that my technical know-how could be better.

Design: After working in film distribution, art museum management, blogging, and film producing, I’d like to think I have a decent grasp of aesthetics and what looks/feels right on a project.

I make good connections with contacts and get some mileage out of a small amount of information.  I do some freelance journalism so I enjoy writing. My previous work was in museum and PR for a horror movie company, so my knowledge spans from art history to how to make a convincing looking exploding head using common household items. I like connecting the dots between things. Think of it as playing Six Degrees of Kevin Bacon, but with arts, world events, people etc..


TANDEM (0.5)

Let’s build a GUI that combines the power of Google’s Tesseract OCR and FeatureExtractor.

The idea is to build an environment (web-based or standalone) where you can take your text overlayed object, toss it in, and have a save ready output file to take away with you. Generate the data you need to visualize, explore, parse apart, and build the story. There is an interesting dialogue between text and images happening in comics, children’s picture books, marketing materials, illustrated maps, illuminated manuscripts, etc. Get your data, understand the output variables in simple and easy to reference ways, and get back to finding your story.

  • Team Note: Be ready to learn. Everyone involved in this intimidating project will bleed through their role and engage in collaborative learning of each of the elements needed to complete the project. Developers must understand design, designers must understand branding, outreach/branding must understand how the thing works, and the project coordinator must understand how to get conversations rolling to hit deadlines.
  • Developer:  Bravery. Develop clean and clear code that will allow us to wrap our OCR and Image Processing Software as modules to be placed in the overall software. Working understanding of code and willingness to dedicate time to digging into what needs to be written to get this off the ground. Knowledge of Python or a single language at the very least.
  • Designer: Understand user interaction and develop aesthetically simple, intuitive interface. Understand design basics, have a working proficiency in Adobe Design programs. Also maintain brand identity in conjunction with Outreach Coordinator.
  • Outreach Coordinator: Social butterflies. We need community support. Work on creating a voice and an audience for this project. Using not only social media but having the ability to track where our message is working best. What tweets work, what outlets are giving good feedback. We need to make a communal conversation that helps us reach our goal.
  • Project Manager: Keep your hand on the pulse of the schedule, set deadlines, gather learning resources, keep open lines of communication between team members. I have so many people in mind for this and each one can potentially bring an entirely different outcome to the project. I want a project manager who wants to see this thing materialize.

Reassurance – Let’s say we build it in Python and Javascript – Here are key some pieces we can consider:

Google’s Tesseract OCR

Python-tesseract is a python wrapper for google’s Tesseract-OCR

FeatureExtractor (Let’s talk to Lev about this. It is one of his tools afterall.) –

PyJamas GUI Toolkit

#skillset Chris V (@CVDH4)

Here are some key skillsets I can bring to each role.

  • Project Management: Trello and Google Apps are my best friends. Task management, team building, and communication are the guts of what I would bring as project manager. I have professional working experience in the other three positions and know how to create interdepartmental dialogues (namely getting Dev Operations to play nicely with Ad Sales Reps, Editorial, and Marketing.)
  • Developer: This interests me a great deal. I have a basic understanding of Python, Javascript, PHP. I am more proficient in HTML/CSS than anything (Tip of the hat to the days of building custom MySpace pages.) This does however seem like the role that I will learn the most. I want more hands on development experience. It is a stop learning and start creating mentality that drives me here.
  • Design/UX: This is probably my strongest area of experience. I work as a graphic designer and have been involved in many web/mobile design projects. I have a working proficiency with most things made by Adobe including Illustrator, InDesign, Adobe DPS, After Effects, Edge Animate, Edge Code, Dreamweaver, Muse, and Inspect CC. If I was to take on designer I would focus my research on better understanding user interaction, prototyping, and front end development.
  • Outreach: Brand is everything. (I fear working in marketing has ruined me for life.)

I currently work at Queens College in the Center for Teaching and Learning as program assistant as well as a Digital Fellow for the Writing Across the Curriculum Department. That means I have a pool of learning resources that we can tap into, a place to have meetings, and a full media lab at our disposal.

#skillset@SteveReal

I tried to think about what I would bring to each of the roles. Here is my #skillset:

Project Management: I have 30 years of experience managing software development projects. This is such an obviously good fit, that I think I would prefer a role that is new to me and forces me to learn. I would gladly help out in the project management capacity.

Developer: I am a “baby” Python programmer, which is to say that I know the basics, but have little experience. I know a little R and have old experience (can you say COBOL?) developing code. I am quite tenacious at problem solving and learning new technology and have a pretty broad background at the conceptual level. I would enjoy this role.

Design/UX: In my career, I have quite a bit of experience in this area as it pertains to software usability. I have seen a project fail when it met all the requirements, but was hard to use. I am not a graphically talented person, so making a project “look beautiful” is not something I would be good at. I would be glad to play this role focusing on “ease of use”.

Outreach: I have limited ability to use social media. I am a Twitter and Facebook dabbler. I am dubious that this would be the best use of my labor.

#Skillset @jojokarlin

Hey #RealWorld #DHPraxis14,

I thought I’d at least start a post (to be edited should the need arise).

#Skillset I offer you:

  1. coordinating/interfacing with people (I like people)
  2. multimodal production experience (I’m an actress, but have worked in most aspects of theatrical production — stage management, direction, music, tech, design — so am pretty comfortable combining different forms/formats to create a unified product).
  3. editing (I like grammar and punctuation (parentheticals especially)). This skill comes with a general love of/attention to details.
  4. positive attitude — enthusiasm and pragmatism — I am impatient to dive in, but patient with failure. I am critical without being judgmental.
  5. creativity (#ironicemptyspace)
  6. cookie baking (I am not above baked good bribery).

See you Tuesday.

-Jojo

Dataset Play: Setting Things Up for Analysis

This post is an attempt to journal some of the attempts I have made to construct a useful space for an art historian who specializes in Dutch colonial art. She has been collecting images of the historic buildings along Breedestraat in Willemstad Curacao. After exploring the options available for tagging photos to particular points on GoogleMaps (mapsengine is now “My Maps”).

creating maps, Breedestraat, Willemstad, Curacao

creating maps, Breedestraat, Willemstad, Curacao

I was not achieving the visual flexibility I needed. The purpose of the project is not to simply see one photo at a time, but to be able to look at the photos side by side as they were in the past and as they are now.

My maps?

My maps?

Then I considered using a WordPress site. Assigning specific categories to each photo, I thought perhaps I could create pages that would pull up images based on separate categories. That way, MvLK could have one page of all the buildings as they existed in the 1890s and one page of a single building from 1890s until today. A website would also perhaps be easier for adding new images. As long as the available categories existed, she could upload photos, post them with categories marked, and they would be automatically appear on the appropriate page.

Screen Shot 2014-11-08 at 11.05.39 PM

Why aren’t the images showing, Minimatica Theme???

After trying out a number of themes — in an attempt to show the images in the most legible way for MvLK’s purposes– Minimatica seemed great but the pictures wouldn’t show up on the main screen, even though they seemed to be properly put in; Spun, the theme I use, was nice because the pictures of each post are visible on the home page, but the buildings would be better served by square or rectangular thumbnails– I have settled at least for the time being on Arias. I have to adjust thumbnails to see if it will work. The site is willemstad.commons.gc.cuny.edu.


Creating Categories

Welcome page

I like Imbalance 2 because it seems to keep the navigation easy, but I don’t like the distance from the header to the content.

How can you compare photos if they don't fit in the screen?

How can you compare photos if they don’t fit in the screen?

Another possibility I’ve been toying with is Omeka.net.

Screen Shot 2014-11-09 at 1.02.34 AMScreen Shot 2014-11-09 at 1.12.14 AM

Digital Fellow Patrick Smyth talked me through potential ways to use Omeka but the issue seemed to be where to host the data. WordPress also has this issue — how will I transfer editing control to her — I am currently using the Commons (woot!) as my workspace.

I went to the digital fellow office hours yesterday and Patrick and Evan were both helping me consider various map options. Takeaway was that I should learn Leaflet and teach myself the leaflet javascript packet (as my starter to learning the seemingly invaluable javascript totality).

At this point it’s been interesting to interrogate ways to go about assembling the images. Maps continue to intrigue me, but this project seems more about how to appropriate affix metadata to images for easy shuffling between images.

I will let you know how things progress.

-Jojo

Mapping Data: Workshop 3/3

Hi all,

Just to follow up on Mary Catherine’s post about finding data, I wanted to recap the final session of this workshop series that took place tonight.

The library guide on mapping data (by Margaret Smith) can be found here: http://libguides.gc.cuny.edu/mappingdata

As in the other two workshops, Smith emphasized thinking about who would be keeping this data and why as a part of the critical research process. It’s especially interesting given the size of these data sets and maps, meaning that the person (or corporate entity, NGO, or government agency) likely has a very specific reason for hosting this information.

She brought us through a few examples from basic mapping sites, like the NYT’s “Mapping America” which pulls on 2005-2009 Census Bureau data, to basic mapping applications like Social Explorer (the free edition has limited access, but the GC has bought full access) and the USGS and NASA mapping applications. The guide also includes a few more advanced mapping options, like ArcGIS, but the tool that seemed most useful to me, in the short-term anyway, is Google’s Fusion Tables, which allows you to merge data sets that have terms in common. The example Smith used was a data set of demographic data (her example was percentage of minority students) organized by town name (her example was towns in Connecticut) and a second set of data that defined geographic boundaries by the same set of towns. Fusion Tables then lets you map the demographic data and select various ways to visualize and customize your results.

My main takeaway from this series was that each of these tools is highly particular and unique, and you have to really dig into playing with the individual system before you’ll even know if it is the right tool for your work.

That, and also learn R.

Finding Data: Preliminary Questions

Hello, all,

As promised, here’s a link to the “Finding Data” library guide on the Mina Rees Library site. Apologies if someone has posted it already!

http://libguides.gc.cuny.edu/findingdata

The guide was created by the wonderful Margaret Smith, an adjunct librarian at the GC Library who is teaching the workshops on data for social research. There’s one more–Wednesday, 6:30-8:30pm downstairs in the library in one of the computer labs–and I’m sure she’d be happy to have anyone swing by. Check out the Library’s blog for details.

Within this guide, the starting questions that Smith provides, in order to get you thinking of your dataset theoretically as well as practically, are very helpful–and I wish I had them years ago! Here are some highlights, taken directly from the guide (but you should really click through!):

HOW TO FIND DATA:

When searching for data, ask yourself these questions…

Who has an interest in collecting this data?

  • If federal/state/local agencies or non-governmental organizations, try locating their website and looking for a section on research or data.
  • If social science researchers, try searching ICPSR.

What literature has been written that might reference this data?

  • Search a library database or Google Scholar to find articles that may have used the data you’re looking for. Then, consult their bibliographies for the specific name of the data set and who collected it.

HOW TO CONSIDER USING IT:

Is the data…

  • From a reliable source? Who collected it and how?
  • Available to the public? Will I need to request permission to use it? Are there any terms of use? How do I cite the data?
  • In a format I can use for analysis or mapping? Will it require any file conversion or editing before I can use it?
  • Comparable to other data I’m using (if any)? What is the unit of analysis? What is the time scale and geography? Will I need to recode any variables?

And another thought that I really loved from her first workshop in this series:

Consider data as an argument.

Since data is social, what factors go into its production? What questions does the data ask? And how do the answers to these questions, as well as the questions above, affect the ways in which that dataset can shed light on your research questions?

All fantastic stuff–looking forward to seeing more of these data inquiries as they pop up on the blog!

(again, all bulleted text is from the “Finding Data” Lib Guide, by Meg Smith, Last Updated Oct. 15 2014. http://libguides.gc.cuny.edu/findingdata)

MC

Stitching on the Old to the New: Tracking Change through Maps

I recently attended a workshop on Map Warper at NYPL that dealt with ‘georectifying’, an often arduous and tedious post-digitizing processing of maps, that the NYPL Map Division has managed to turn into a fun and engaged activity by opting to crowdsource it. Funded by the NEH, the Map Warper is a tool suite, used by library staff but also open to the public, to align (or “rectify”) historical maps to today’s digital maps, adding valuable geographic context to old maps. Importantly, all work done is in the public domain. In NYPL’s words,

“Tile by tile, we’re stitching old atlas sheets into historical layers, that researchers can explore with pan-and-zoom functionality, comparing yesterday’s cityscape with today’s. Along with other tools — such as one for tracing building footprints and transcribing address and material information found on the maps — we are laying the groundwork for dynamic geospatial discovery of other library collections: manuscripts and archives, historical newspapers, photography, A/V, ephemera (e.g. menus) etc.”

Given our discussions these past weeks, it seems to me that the points of departure are numerous. I’m reminded of Sarah’s post on mapping the urban setting of fictional characters, when I think about how this tool can help recreate the urban setting of historical characters/personages in today’s context. All one needs is a time period and location, if the Map Division has a corresponding map, lo, and behold! you can see the past and present streetscapes simultaneously.  From an urban planning perspective, it is fascinating to see how the cityscape wears the passage of time and explore possible lessons for urban design. I expect it also will help planners visualize and chart the imperceptible movement of real estate, the steady shift of the cityscape over the underlying landscape, which is only possible with tools such as this.

warper-labs

Source: Map Warper, NYPL Labs

“The above image shows a warped map sheet from an 1857 William Perris Real Estate Atlas depicting a section of Manhattan to the southwest of Union Square (see it in the context of the Warper). By stitching this to its sibling sheets from the atlas, we can build a complete 1857 historical layer of Manhattan, observing changes in the street layout and conjuring the ghostly footprints of old buildings. This is just step 1 in a larger integration effort, in which we can pull together archival records, newspapers, photography and other literary and historical documents that are associated with places on the map.”

Link – http://maps.nypl.org/warper/

For those of you interested, there is also a helpful tutorial video on their website to get you started on the project, and helpful Map Division staff are available for tech support.